library(ggtreeExtra)
library(ggtree)
library(treeio)
library(tidytree)
library(ggstar)
library(ggplot2)
library(ggnewscale)
library(ggiraph)
library(TDbook)
# load data from TDbook, including tree_hmptree,
# df_tippoint (the abundance and types of microbes),
# df_ring_heatmap (the abundance of microbes at different body sites),
# and df_barplot_attr (the abundance of microbes of greatest prevalence)
tree <- tree_hmptree
dat1 <- df_tippoint
dat2 <- df_ring_heatmap
dat3 <- df_barplot_attr
# adjust the order
dat2$Sites <- factor(dat2$Sites,
levels=c("Stool (prevalence)", "Cheek (prevalence)",
"Plaque (prevalence)","Tongue (prevalence)",
"Nose (prevalence)", "Vagina (prevalence)",
"Skin (prevalence)"))
dat3$Sites <- factor(dat3$Sites,
levels=c("Stool (prevalence)", "Cheek (prevalence)",
"Plaque (prevalence)", "Tongue (prevalence)",
"Nose (prevalence)", "Vagina (prevalence)",
"Skin (prevalence)"))
# extract the clade label information. Because some nodes of tree are
# annotated to genera, which can be displayed with high light using ggtree.
nodeids <- nodeid(tree, tree$node.label[nchar(tree$node.label)>4])
nodedf <- data.frame(node=nodeids)
nodelab <- gsub("[\\.0-9]", "", tree$node.label[nchar(tree$node.label)>4])
# The layers of clade and hightlight
poslist <- c(1.6, 1.4, 1.6, 0.8, 0.1, 0.25, 1.6, 1.6, 1.2, 0.4,
1.2, 1.8, 0.3, 0.8, 0.4, 0.3, 0.4, 0.4, 0.4, 0.6,
0.3, 0.4, 0.3)
labdf <- data.frame(node=nodeids, label=nodelab, pos=poslist)
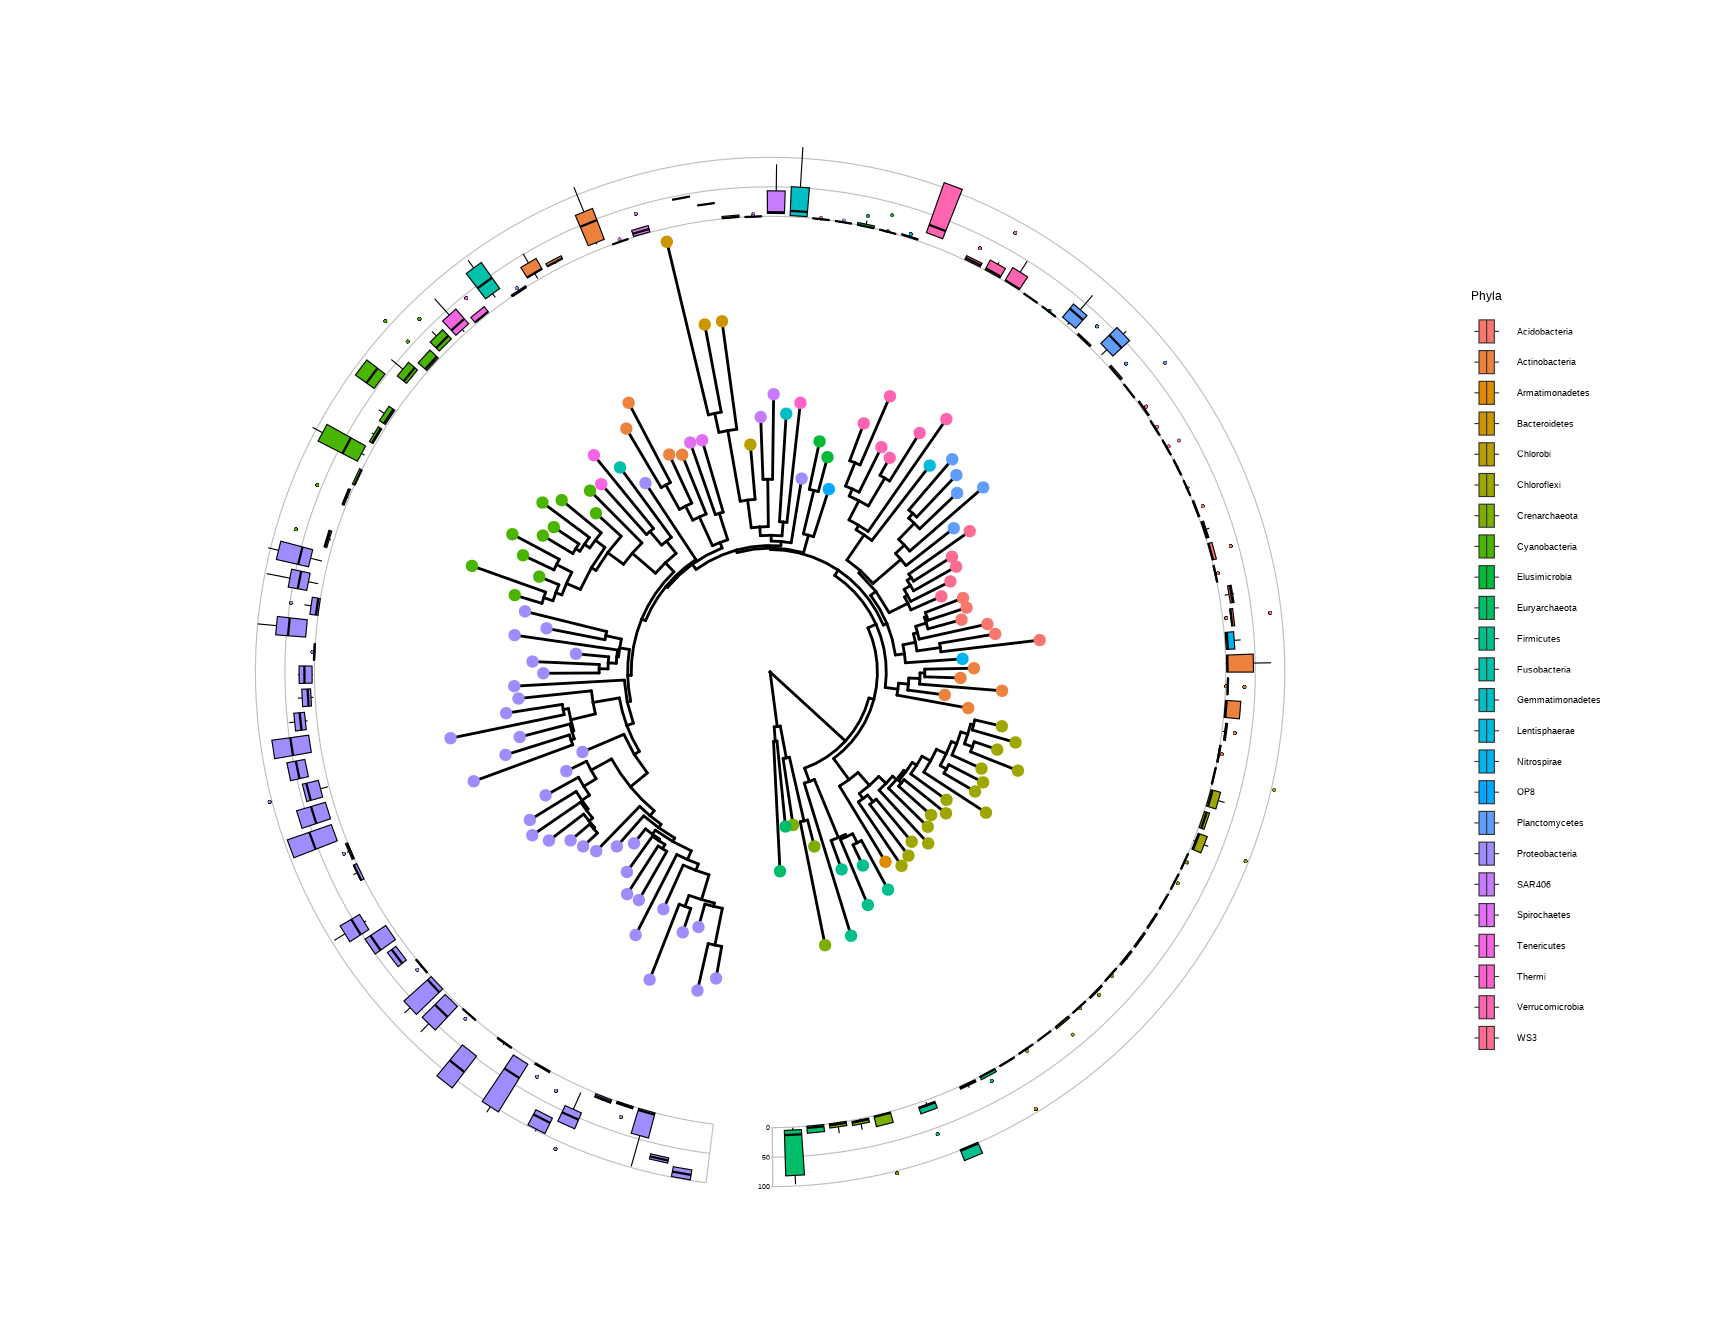
# The circular layout tree.
p <- ggtree(tree, layout="fan",
mapping = aes(tooltip = round(branch.length,2), data_id=node),
size=0.15, open.angle=5) +
geom_hilight(data=nodedf,
mapping=aes(node=node, tooltip = node, data_id = node),
extendto=6.8, alpha=0.3, fill="grey", color="grey50",
size=0.05, to.bottom = TRUE) +
geom_cladelab(data=labdf,
mapping=aes(node=node,
label=label,
offset.text=pos,
tooltip = label,
data_id = label),
hjust=0.5,
angle="auto",
barsize=NA,
horizontal=FALSE,
fontsize=1.4,
fontface="italic"
)
p <- p %<+% dat1 + geom_star_interactive(
mapping=aes(subset=isTip,
fill=Phylum,
starshape=Type,
size=Size,
tooltip = paste0(Phylum,"\n", label),
data_id = label),
position="identity",starstroke=0.1) +
scale_fill_manual(values=c("#FFC125","#87CEFA","#7B68EE","#808080",
"#800080", "#9ACD32","#D15FEE","#FFC0CB",
"#EE6A50","#8DEEEE", "#006400","#800000",
"#B0171F","#191970"),
guide=guide_legend(keywidth = 0.5,
keyheight = 0.5, order=1,
override.aes=list(starshape=15)),
na.translate=FALSE)+
scale_starshape_manual(values=c(15, 1),
guide=guide_legend(keywidth = 0.5,
keyheight = 0.5, order=2),
na.translate=FALSE)+
scale_size_continuous(range = c(1, 2.5),
guide = guide_legend(keywidth = 0.5,
keyheight = 0.5, order=3,
override.aes=list(starshape=15)))
p <- p + new_scale_fill() +
geom_fruit(data=dat2, geom=geom_tile_interactive,
mapping=aes(y=ID, x=Sites, alpha=Abundance, fill=Sites,
tooltip = round(Abundance, 2),
data_id = paste0(Sites, ID)),
color = "grey50", offset = 0.04,size = 0.02)+
scale_alpha_continuous(range=c(0, 1),
guide=guide_legend(keywidth = 0.3,
keyheight = 0.3, order=5)) +
geom_fruit(data=dat3, geom=geom_bar_interactive,
mapping=aes(y=ID, x=HigherAbundance, fill=Sites,
tooltip = round(HigherAbundance, 2),
data_id = paste0(Sites, ID)),
pwidth=0.38,
orientation="y",
stat="identity",
) +
scale_fill_manual_interactive(
values=c("#0000FF","#FFA500","#FF0000",
"#800000", "#006400","#800080","#696969"),
data_id = function(breaks) as.character(breaks),
tooltip = function(breaks) as.character(breaks),
onclick = function(breaks) paste0("alert(\"", as.character(breaks), "\")"),
guide=guide_legend(keywidth = 0.3,
keyheight = 0.3, order=4)
)+
geom_treescale(fontsize=2, linesize=0.3, x=4.9, y=0.1) +
theme(legend.position=c(0.93, 0.5),
legend.background=element_rect(fill=NA),
legend.title=element_text(size=6.5),
legend.text=element_text(size=4.5),
legend.spacing.y = unit(0.02, "cm"),
)
ggtree_set_interactive()
p