set.seed(123)
tr <- rtree(20)

p <- ggtree(tr)
p
ggtreeTree figures are often used in two different modes.
In the first mode, you prepare a static figure for a manuscript or a report. The goal is to be stable and reproducible. In the second mode, you explore: you hover to read values, identify elements, and verify that layers match the intended nodes or clades.
ggtree supports an interactive mode designed for exploration. The design principle is simple: you switch interactivity on and off, while keeping the same plotting code and the same ggtree objects. When interactivity is enabled, printing a plot returns an HTML widget; when it is disabled, the same plot prints as a static figure.
Start with a normal ggtree plot.
set.seed(123)
tr <- rtree(20)
p <- ggtree(tr)
p
Enable interactive mode and print the same object again.
ggtree_set_interactive()
p
Warning: Interactive visualization of ggtree requires specific interactive attributes,
such as `tooltip`, `onclick`, or `data_id`; without them,
no interactive features will be available!At this stage, the output may still look “plain”. This is expected: interactivity requires you to tell ggtree what should be shown on hover and how graphical elements should be identified.
When you are done exploring and want static output again, disable interactive mode.
ggtree_unset_interactive()
p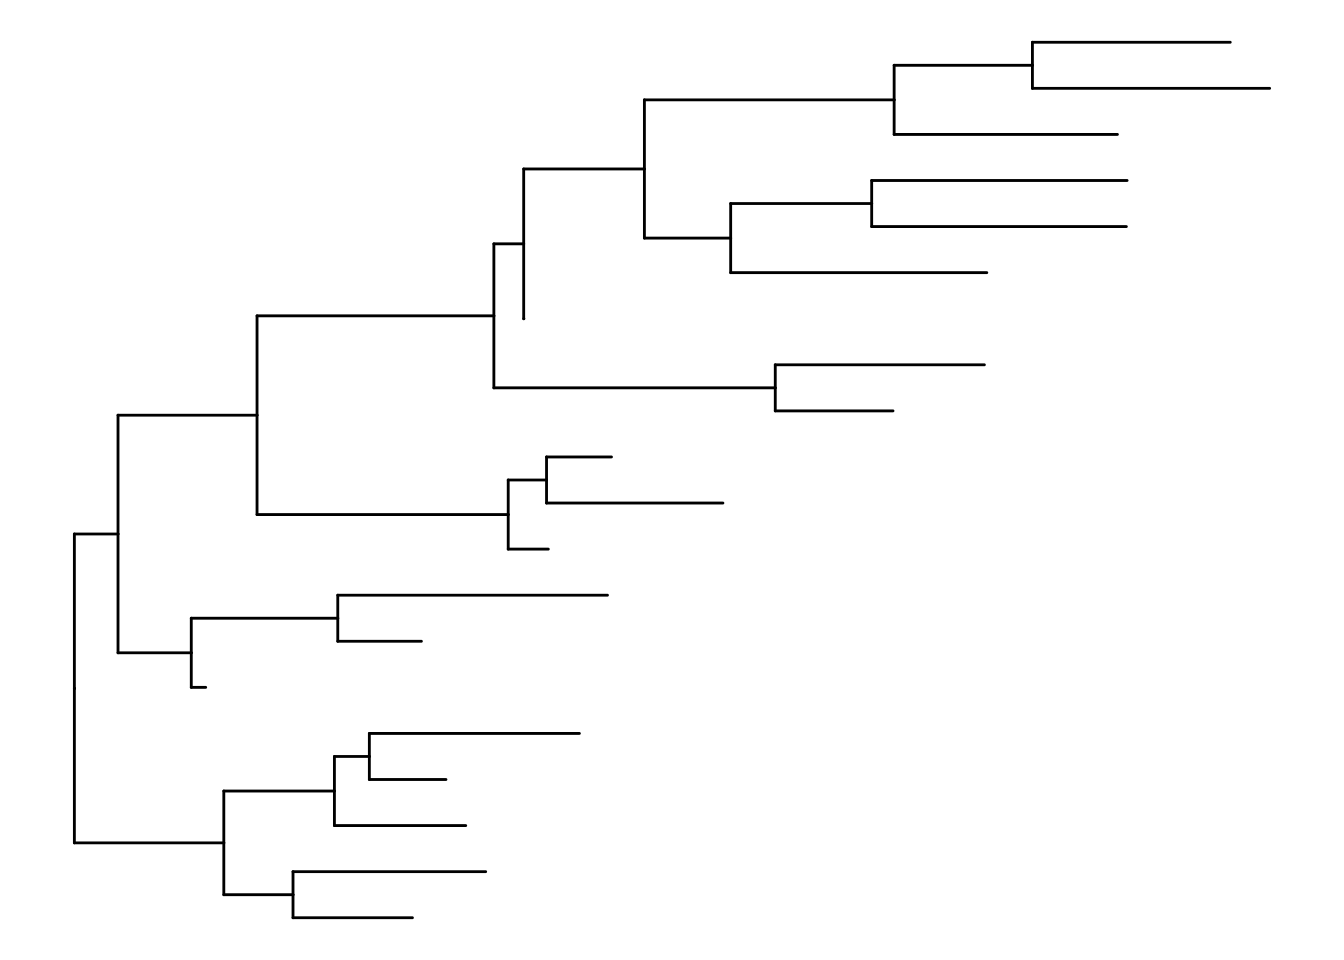
tooltip and data_idInteractive behavior is controlled by two aesthetics:
tooltip supplies the content shown when hovering over an element.data_id supplies a unique identifier for elements so that the widget can map hover/click events back to specific branches, nodes, or layers.The following example uses branch length as the tooltip and uses node IDs as element identifiers.
ggtree_set_interactive()

p2 <- ggtree(
  tr,
  mapping = aes(
    tooltip = round(branch.length, 2),
    data_id = node
  )
)

p2
With these two mappings, hovering over branches should display the tooltip, and the hovered element will be visually emphasized.
You can add interactive behavior to additional layers in the same way: by supplying tooltip and data_id in the layer mapping. This is useful when you highlight clades, place symbols, or add annotations and want them to participate in the interactive view.
dt <- data.frame(id = c(36, 38), type = c("A", "B"))

p3 <- p2 +
  geom_hilight(
    data = dt,
    mapping = aes(
      node = id,
      fill = type,
      tooltip = paste0("clade of node ", id),
      data_id = type
    ),
    to.bottom = TRUE
  )

p3
In interactive mode, hover emphasis is applied on top of the original colors. If a highlighted region appears to mismatch the legend while hovering, it is usually the hover overlay. The underlying colors remain unchanged.
Interactive plots are intended for HTML output. For PDF export and static raster/vector formats, disable interactive mode and print the same plot.
ggtree_unset_interactive()
p3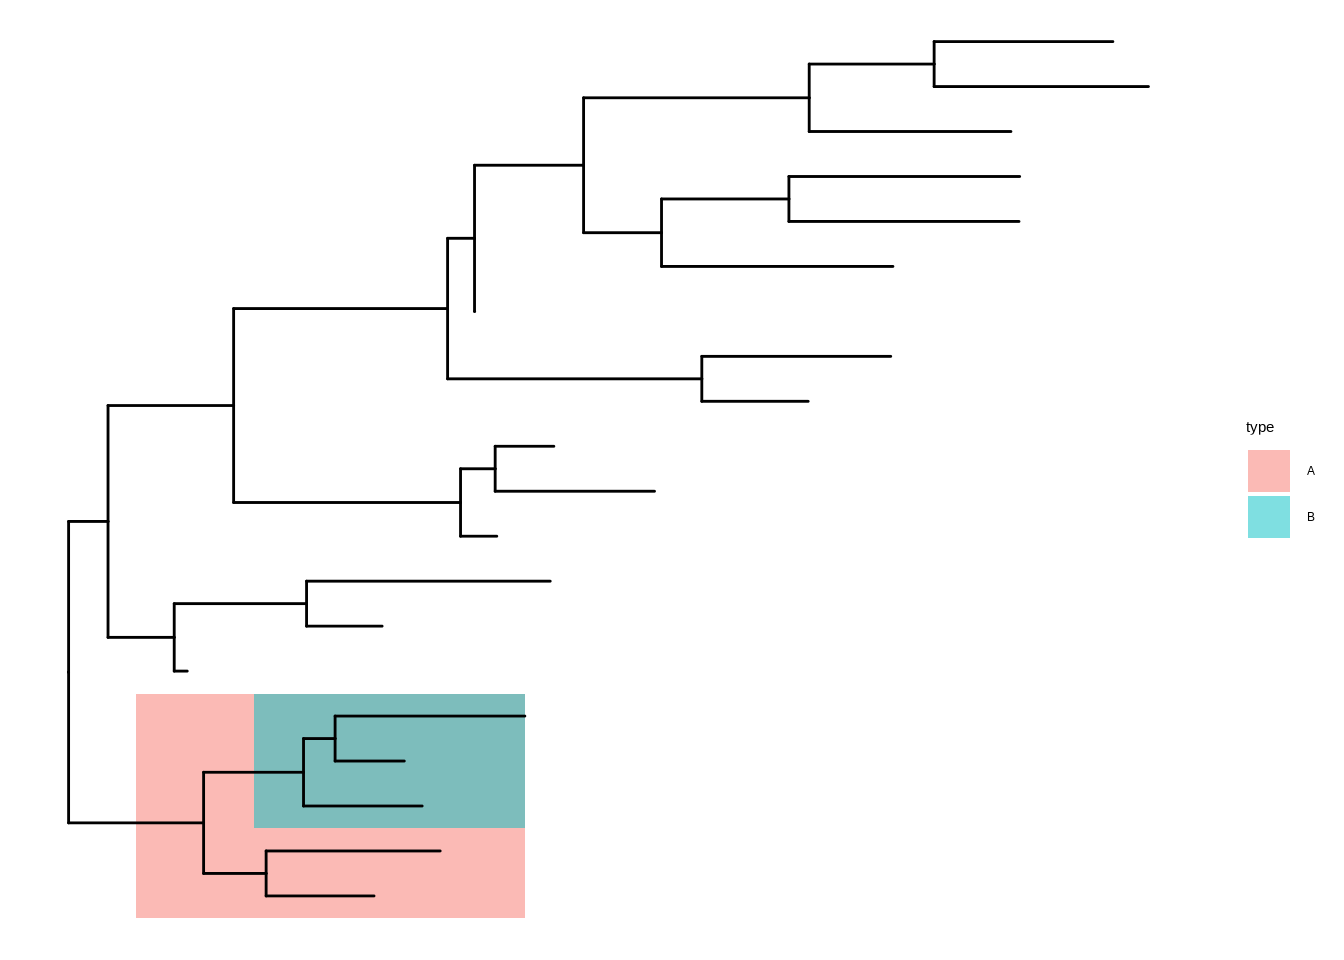
This workflow allows you to use interactivity during exploration while keeping a single plotting script for both interactive inspection and final figure export.
For a more complex and comprehensive example of interactive ggtree visualization, including multiple data layers and complex mappings, please refer to the HMP microbiome data visualization in Chapter 11. That example demonstrates how to combine ggtreeExtra with interactive features to explore multi-dimensional data associated with a phylogenetic tree.
data_id values within each layer.