7 Functional Enrichment Analysis
sclet provides RunEnrichment to seamlessly perform GO/KEGG enrichment analysis on marker genes.
7.1 Load data and find markers
library(sclet)
sce <- readRDS("data/pancreas_sub_sce.rds")
# Find markers for all clusters
markers <- FindAllMarkers(sce, only.pos = TRUE, min.pct = 0.25, logfc.threshold = 0.25)
## Calculating markers for all clusters using presto...## pval padj avg_log2FC pct.1 pct.2
## Irx1 5.512395e-89 8.796681e-85 1.642432 0.615 0.035
## Tmem27 2.513287e-80 2.005352e-76 10.780989 0.985 0.280
## Peg10 4.295250e-73 2.284787e-69 3.802655 0.741 0.112
## Irx2 2.194301e-71 8.754163e-68 1.730250 0.637 0.067
## Ctxn2 3.279432e-59 1.046663e-55 0.841490 0.474 0.037
## Arx 8.099916e-55 2.154308e-51 1.898095 0.711 0.132
## cluster gene avgExpr statistic auc
## Irx1 Alpha Irx1 1.7037037 92693.0 0.7937744
## Tmem27 Alpha Tmem27 11.9555556 109864.5 0.9408221
## Peg10 Alpha Peg10 4.0962963 97572.5 0.8355598
## Irx2 Alpha Irx2 1.8666667 92421.0 0.7914451
## Ctxn2 Alpha Ctxn2 0.8888889 84262.0 0.7215757
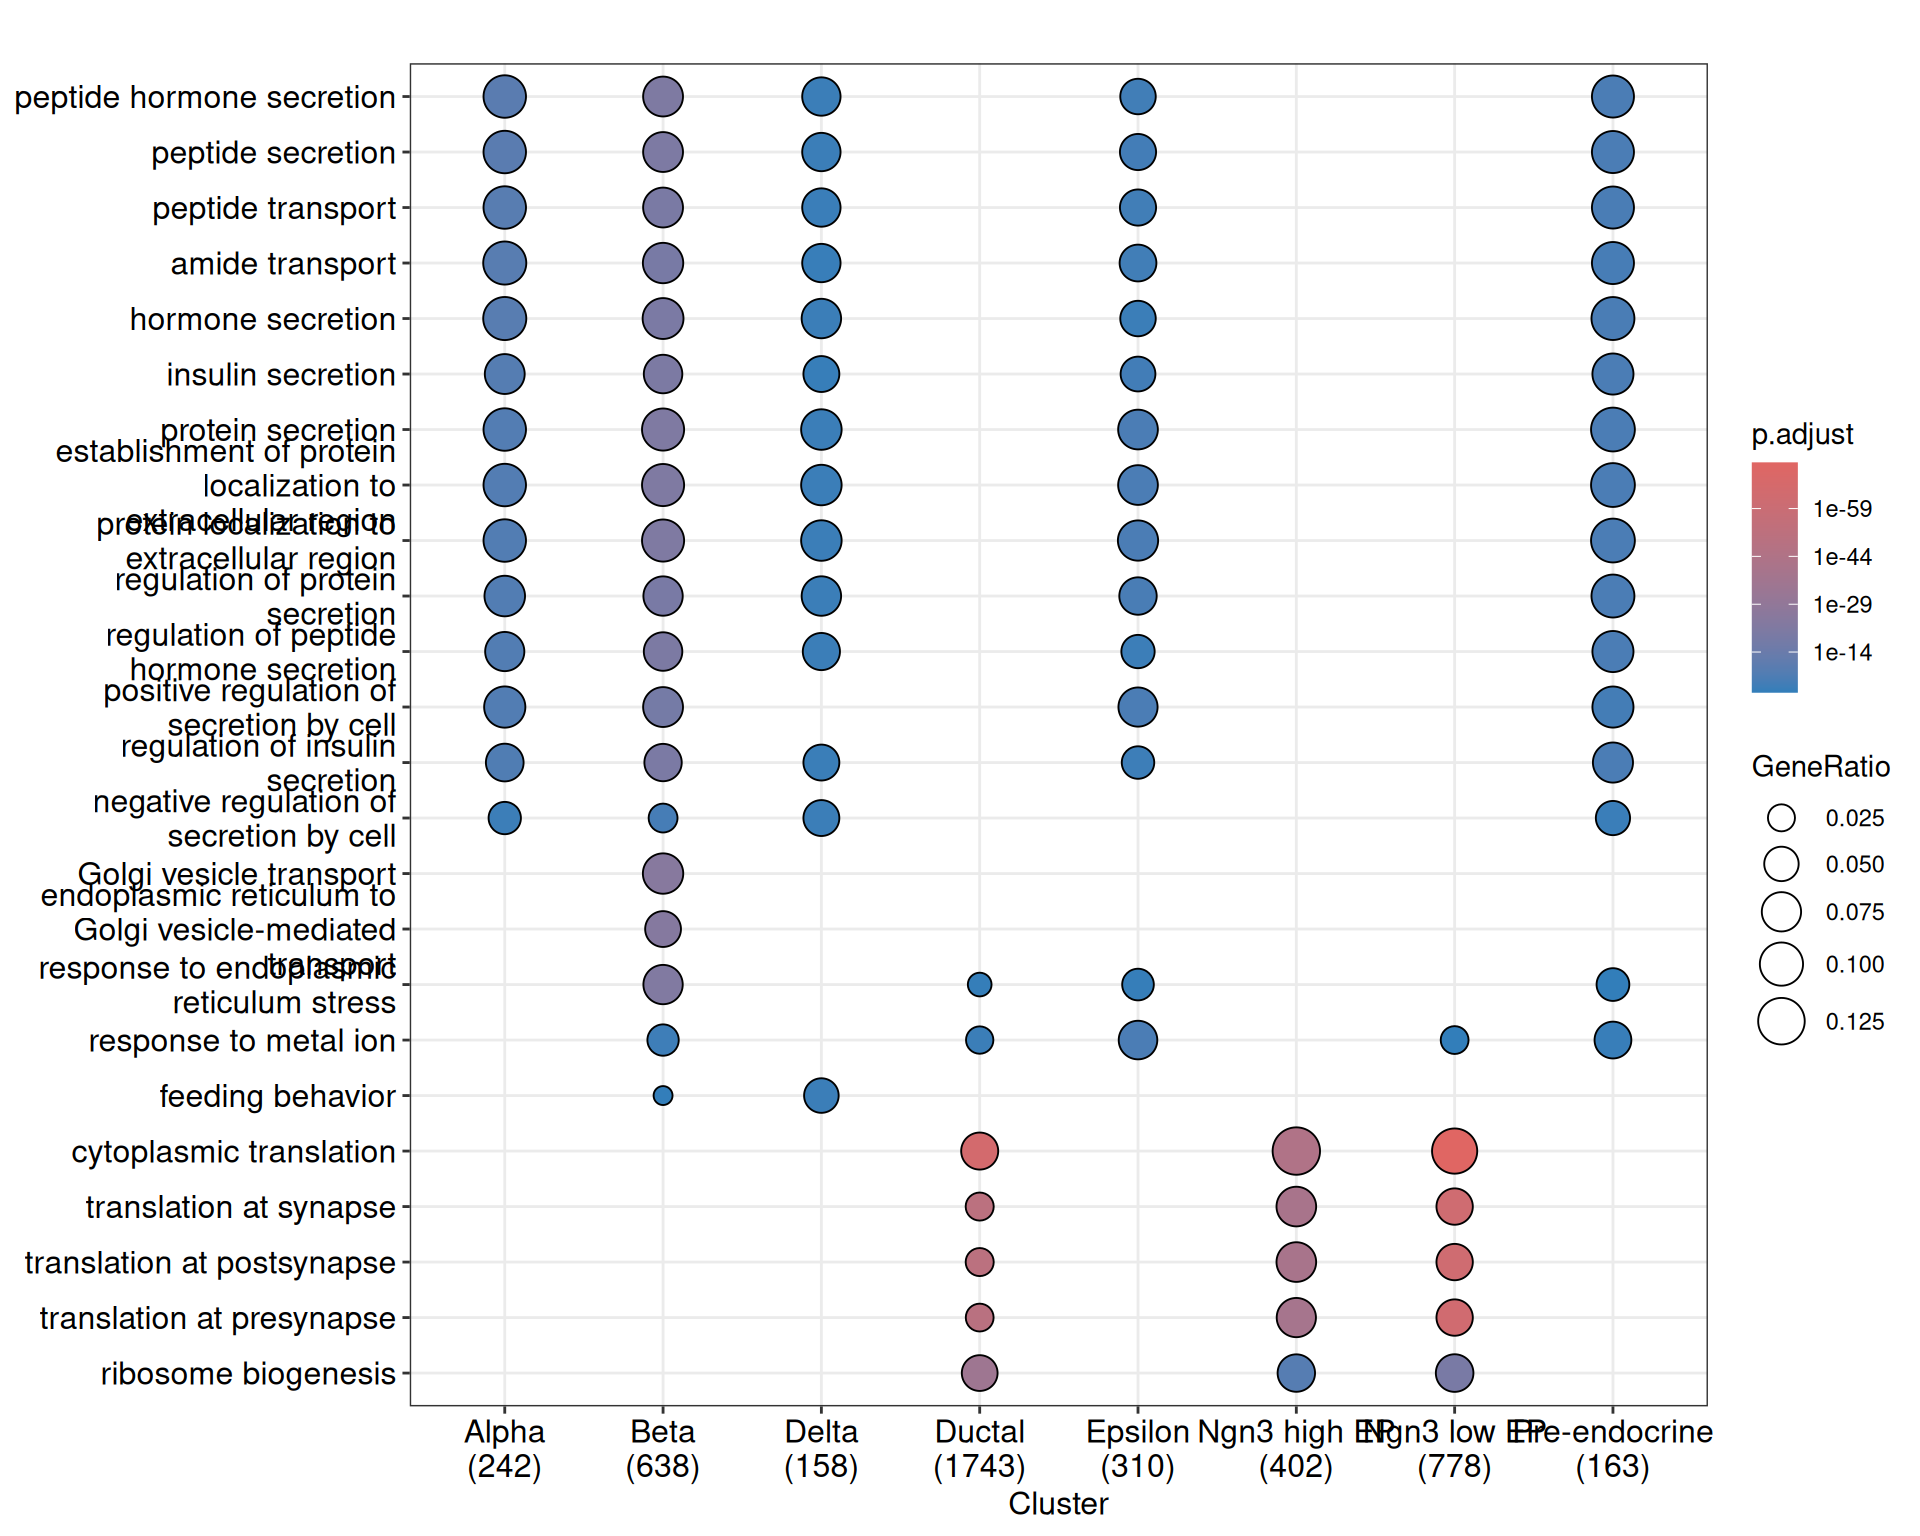
## Arx Alpha Arx 2.2518519 93020.0 0.79657467.2 GO Enrichment
# Ensure you have org.Mm.eg.db installed for Mouse data
# or org.Hs.eg.db for Human
library(org.Mm.eg.db)
## Loading required package: AnnotationDbi##
## Attaching package: 'AnnotationDbi'## The following object is masked from 'package:dplyr':
##
## select## go_res <- RunEnrichment(
markers,
db = "GO",
orgDb = "org.Mm.eg.db",
keyType = "SYMBOL",
ont = "BP"
)
library(enrichplot)## enrichplot v1.30.4 Learn more at https://yulab-smu.top/contribution-knowledge-mining/
##
## Please cite:
##
## Guangchuang Yu, Fei Li, Yide Qin, Xiaochen Bo, Yibo
## Wu and Shengqi Wang. GOSemSim: an R package for
## measuring semantic similarity among GO terms and gene
## products. Bioinformatics. 2010, 26(7):976-978