2 Batch Correction
2.1 Load datasets
We load the PBMC 3k and 4k datasets using TENxPBMCData. Note that these datasets use Ensembl IDs as row names by default. To facilitate downstream analysis (e.g., cell type annotation with SingleR which requires Gene Symbols matching the reference), we map the Ensembl IDs to Gene Symbols. We use scuttle::uniquifyFeatureNames() to perform this mapping while ensuring that the resulting row names remain unique.
## Loading required package: SingleCellExperiment## Loading required package: SummarizedExperiment## Loading required package: MatrixGenerics## Loading required package: matrixStats##
## Attaching package: 'matrixStats'## The following object is masked from 'package:dplyr':
##
## count##
## Attaching package: 'MatrixGenerics'## The following objects are masked from 'package:matrixStats':
##
## colAlls, colAnyNAs, colAnys, colAvgsPerRowSet,
## colCollapse, colCounts, colCummaxs, colCummins,
## colCumprods, colCumsums, colDiffs, colIQRDiffs,
## colIQRs, colLogSumExps, colMadDiffs, colMads,
## colMaxs, colMeans2, colMedians, colMins,
## colOrderStats, colProds, colQuantiles, colRanges,
## colRanks, colSdDiffs, colSds, colSums2,
## colTabulates, colVarDiffs, colVars,
## colWeightedMads, colWeightedMeans,
## colWeightedMedians, colWeightedSds,
## colWeightedVars, rowAlls, rowAnyNAs, rowAnys,
## rowAvgsPerColSet, rowCollapse, rowCounts,
## rowCummaxs, rowCummins, rowCumprods, rowCumsums,
## rowDiffs, rowIQRDiffs, rowIQRs, rowLogSumExps,
## rowMadDiffs, rowMads, rowMaxs, rowMeans2,
## rowMedians, rowMins, rowOrderStats, rowProds,
## rowQuantiles, rowRanges, rowRanks, rowSdDiffs,
## rowSds, rowSums2, rowTabulates, rowVarDiffs,
## rowVars, rowWeightedMads, rowWeightedMeans,
## rowWeightedMedians, rowWeightedSds,
## rowWeightedVars## Loading required package: GenomicRanges## Loading required package: stats4## Loading required package: BiocGenerics## Loading required package: generics##
## Attaching package: 'generics'## The following object is masked from 'package:dplyr':
##
## explain## The following objects are masked from 'package:base':
##
## as.difftime, as.factor, as.ordered, intersect,
## is.element, setdiff, setequal, union##
## Attaching package: 'BiocGenerics'## The following object is masked from 'package:dplyr':
##
## combine## The following objects are masked from 'package:stats':
##
## IQR, mad, sd, var, xtabs## The following objects are masked from 'package:base':
##
## anyDuplicated, aperm, append, as.data.frame,
## basename, cbind, colnames, dirname, do.call,
## duplicated, eval, evalq, Filter, Find, get, grep,
## grepl, is.unsorted, lapply, Map, mapply, match,
## mget, order, paste, pmax, pmax.int, pmin,
## pmin.int, Position, rank, rbind, Reduce,
## rownames, sapply, saveRDS, table, tapply, unique,
## unsplit, which.max, which.min## Loading required package: S4Vectors##
## Attaching package: 'S4Vectors'## The following objects are masked from 'package:dplyr':
##
## first, rename## The following object is masked from 'package:utils':
##
## findMatches## The following objects are masked from 'package:base':
##
## expand.grid, I, unname## Loading required package: IRanges##
## Attaching package: 'IRanges'## The following objects are masked from 'package:dplyr':
##
## collapse, desc, slice## Loading required package: Seqinfo## Loading required package: Biobase## Welcome to Bioconductor
##
## Vignettes contain introductory material; view
## with 'browseVignettes()'. To cite Bioconductor,
## see 'citation("Biobase")', and for packages
## 'citation("pkgname")'.##
## Attaching package: 'Biobase'## The following object is masked from 'package:MatrixGenerics':
##
## rowMedians## The following objects are masked from 'package:matrixStats':
##
## anyMissing, rowMedians## Loading required package: HDF5Array## Loading required package: SparseArray## Loading required package: Matrix##
## Attaching package: 'Matrix'## The following object is masked from 'package:S4Vectors':
##
## expand## Loading required package: S4Arrays## Loading required package: abind##
## Attaching package: 'S4Arrays'## The following object is masked from 'package:abind':
##
## abind## The following object is masked from 'package:base':
##
## rowsum## Loading required package: DelayedArray##
## Attaching package: 'DelayedArray'## The following objects are masked from 'package:base':
##
## apply, scale, sweep## Loading required package: h5mread## Loading required package: rhdf5##
## Attaching package: 'h5mread'## The following object is masked from 'package:rhdf5':
##
## h5ls## see ?TENxPBMCData and browseVignettes('TENxPBMCData') for documentation## downloading 1 resources## retrieving 1 resource## loading from cache# Replace Ensembl IDs with Gene Symbols (ensuring uniqueness) for compatibility with downstream tools
rownames(pbmc3k) <- scuttle::uniquifyFeatureNames(rownames(pbmc3k), rowData(pbmc3k)$Symbol_TENx)
pbmc4k <- TENxPBMCData(dataset = "pbmc4k")## see ?TENxPBMCData and browseVignettes('TENxPBMCData') for documentation## downloading 1 resources## retrieving 1 resource## loading from cache2.2 Preprocess
library(sclet)

sce_process <- function(sce) {
  sce <- QCMetrics(sce)
  sce[["percent.mt"]] <- PercentageFeatureSet(sce, "^MT-")
  sce <- subset(sce, subset = nFeature_RNA > 200 & nFeature_RNA < 2500 & percent.mt < 5)
  sce <- NormalizeData(sce)
  sce <- FindVariableFeatures(sce)
  return(sce)
}

pbmc3k <- sce_process(pbmc3k)
pbmc4k <- sce_process(pbmc4k)

pbmc_list <- list(pbmc3k = pbmc3k, pbmc4k = pbmc4k)2.4 Clustering
sce_clustering <- function(sce, assay = "logcounts", dims = 1:10) {
  sce <- runPCA(sce, subset_row = VariableFeatures(sce), exprs_values = assay)
  sce <- FindNeighbors(sce, dims = dims)
  sce <- FindClusters(sce)
  sce <- RunUMAP(sce, dims = dims)
  return(sce)
}

combined_pbmc <- sce_clustering(combined_pbmc, assay="logcounts")

rm_batch_pbmc <- sce_clustering(rm_batch_pbmc, assay = "reconstructed")
2.5 Visualization
library(ggplot2)
library(aplot)

p1 <- DimPlot(combined_pbmc, reduction="UMAP", mapping=aes(color=batch))
p2 <- DimPlot(rm_batch_pbmc, reduction="UMAP", mapping=aes(color=batch))
p3 <- plot_list(Before=p1, After=p2)

p4 <- DimPlot(rm_batch_pbmc, reduction="UMAP")

plot_list(p3, p4, ncol=1, heights=c(1, 2))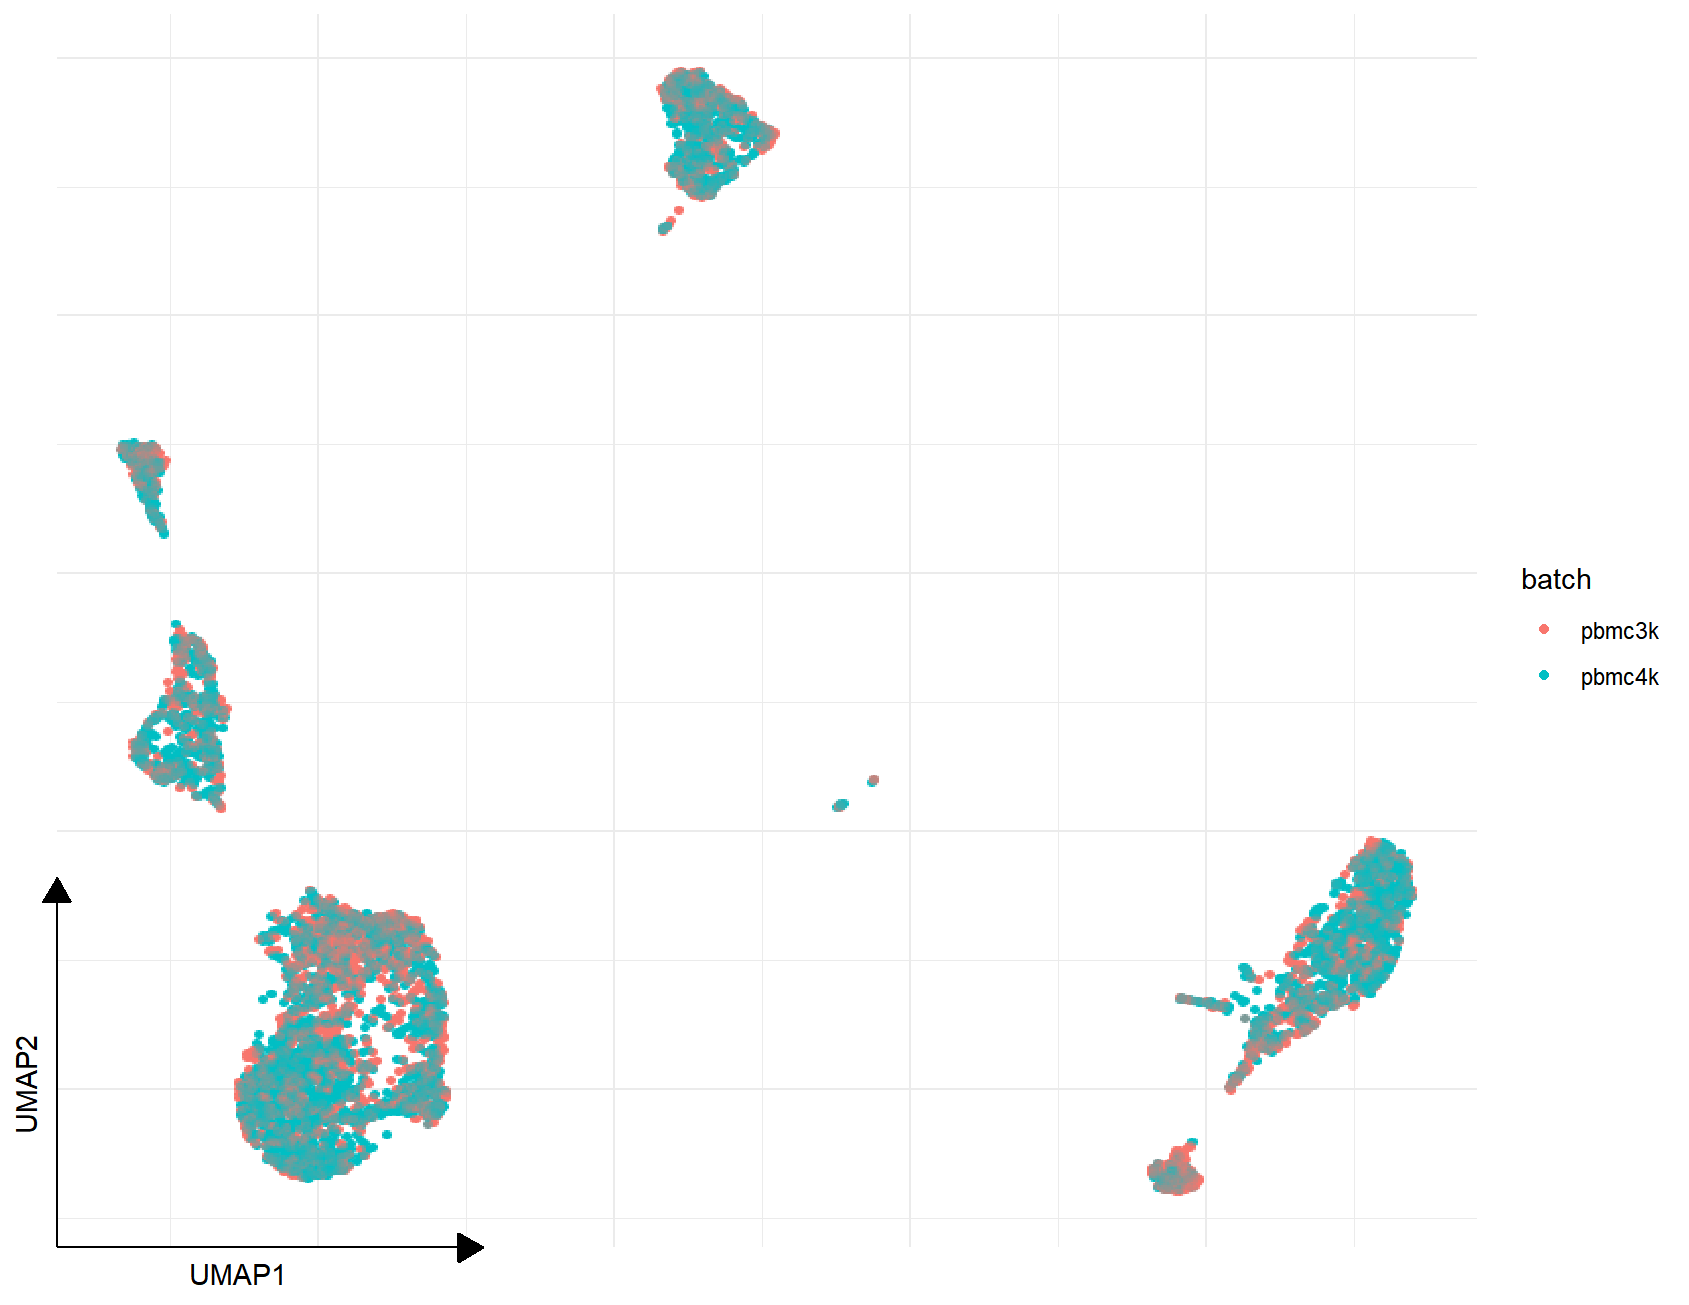
2.6 Pseudobulk Differential Expression
sclet now supports pseudobulk analysis to perform robust differential expression between conditions/samples.
# 1. Aggregate counts by cluster and batch (or sample)
# This creates a pseudobulk SummarizedExperiment
pb <- AggregateExpression(rm_batch_pbmc, group_by = c("label", "batch"))

# 2. Perform DE analysis (using DESeq2)
# Here we test for differences between batches within a specific cluster (e.g., cluster 1)
# Note: Real analysis should have biological replicates, here we use batch as an example.

# Filter for cluster 1 only
pb_cluster1 <- pb[, pb$label == "1"]

# Run DE: test for batch effect
# design formula: ~ batch
# contrast: batch pbmc4k vs pbmc3k
res <- FindMarkers_pseudobulk(pb_cluster1, design = ~ batch, contrast = c("batch", "pbmc4k", "pbmc3k"))

head(res)