9 Gene Set Scoring
Often, relying on the expression of a single gene (like a traditional marker) introduces too much noise and dropout artifacts. If you want to know whether a cell population is undergoing “Hypoxia” or has an active “Cell Cycle”, scoring the entire pathway or gene set is the most robust approach.
However, the algorithm landscape is fragmented: AUCell, UCell, GSVA… Each backend has a different output format. If you want to plot the results downstream, standardizing these formats can be a nightmare.
This is exactly the kind of problem sclet is designed to simplify. We provide the RunGeneSetScoring() interface, which unifies these backends and injects the scores directly into the state-aware workflow and colData, so the results remain easy to inspect and easy to reuse later.
9.1 Multi-Backend Scoring in One Click
Let’s define a few gene sets of interest and run the scoring on our PBMC dataset.
library(sclet)
pbmc <- readRDS("data/pbmc-3k-sce.rds")

# Define signatures
my_signatures <- list(
  T_cell = c("CD3D", "CD3E", "CD8A", "CD4"),
  B_cell = c("CD79A", "MS4A1"),
  Myeloid = c("LYZ", "CD14", "FCGR3A")
)
You can decisively choose the backend that best fits your needs. UCell is rank-based, extremely fast, and highly suitable for single-cell data.
9.2 Reading and Visualizing Results
Where do the scores go after calculation?
1. They are added as columns in the cellular metadata (colData).
2. The action is recorded in the geneset_scoring state machine.
Because the scores are now standard metadata, we can seamlessly reuse the sclet visualization ecosystem (like FeatureDimPlot):
# Visualize the T_cell score distribution on the UMAP space
FeatureDimPlot(pbmc, features = "UCell_Score_T_cell")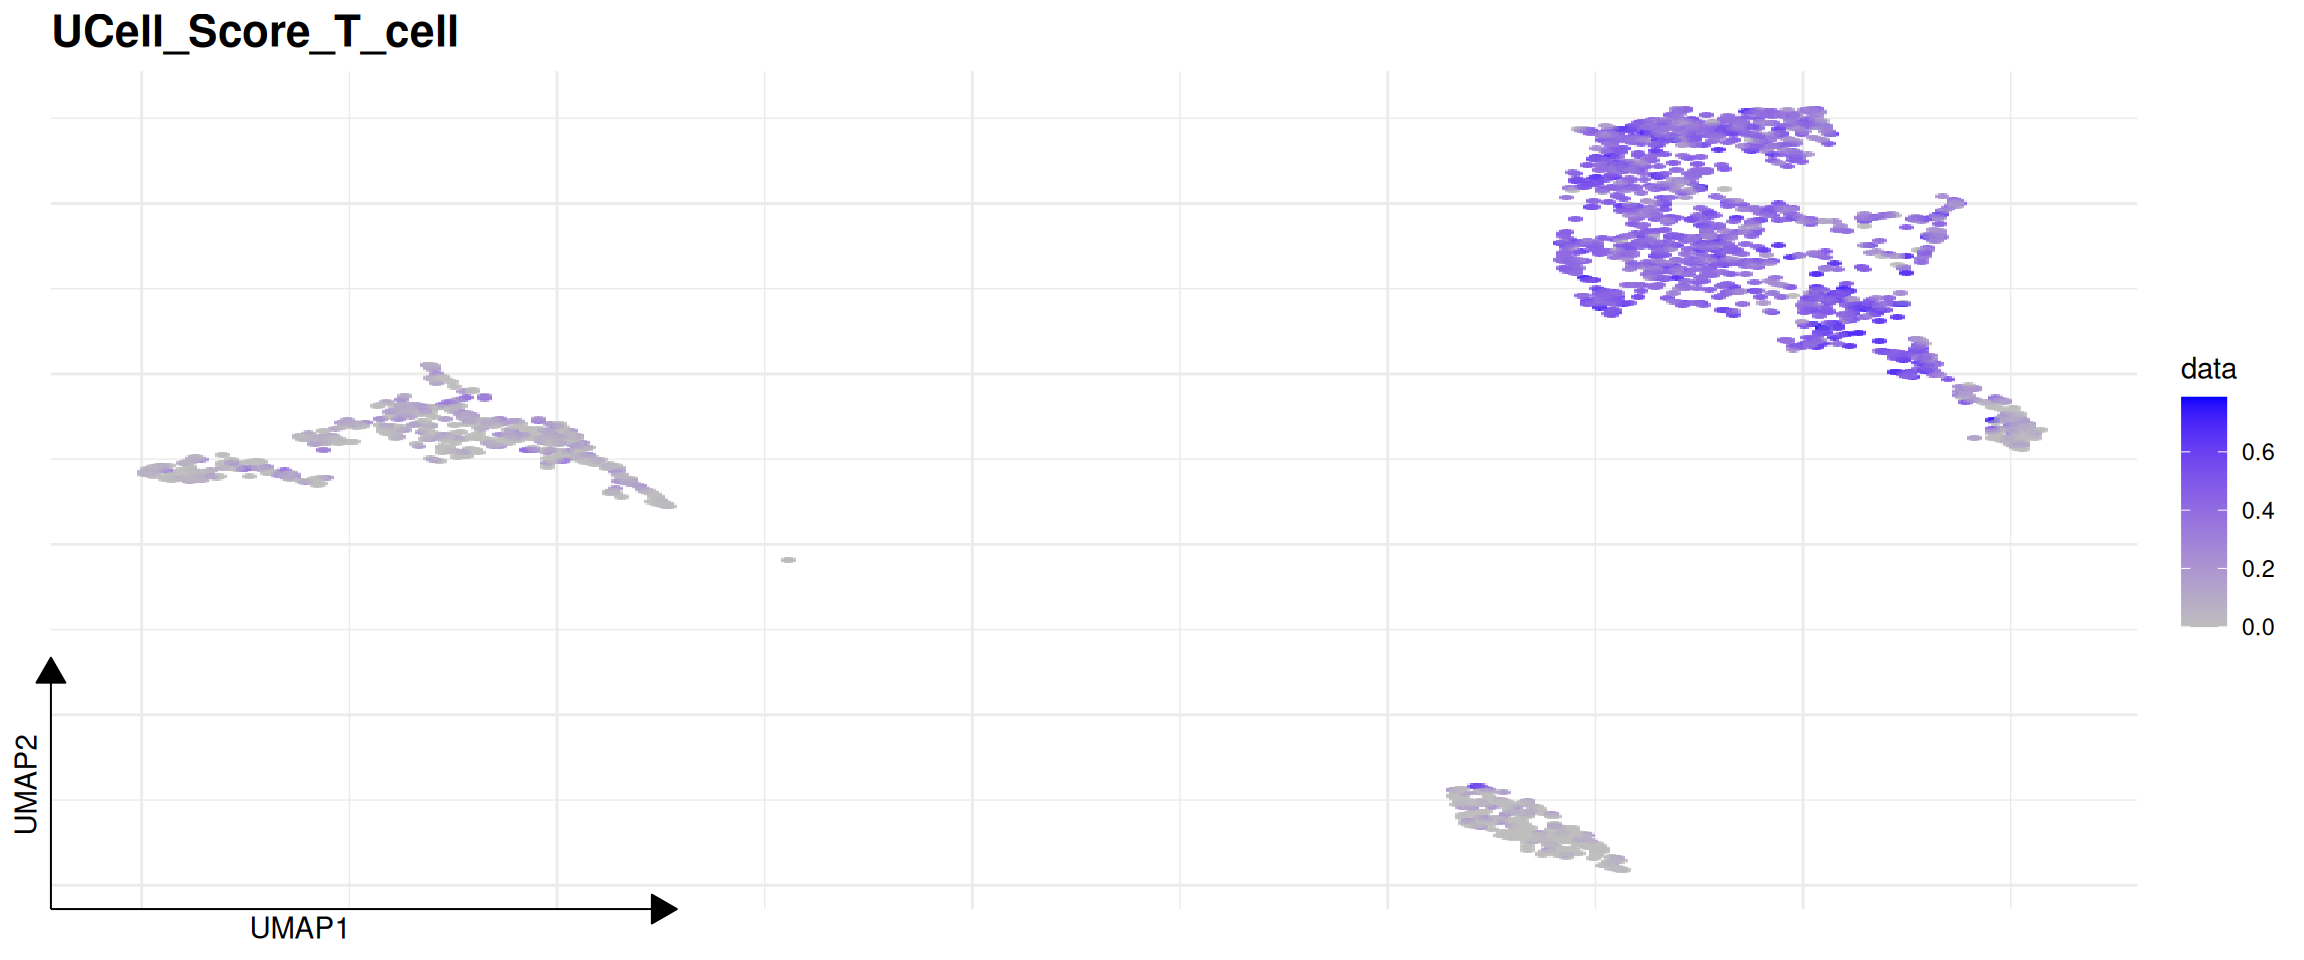
## $method
## [1] "UCell"
##
## $assay_use
## [1] "counts"
##
## $gene_sets
## [1] "T_cell"  "B_cell"  "Myeloid"
##
## $score_columns
## [1] "UCell_Score_T_cell"  "UCell_Score_B_cell"
## [3] "UCell_Score_Myeloid"
##
## $timestamp
## [1] "2026-05-31 04:29:33 UTC"
Bottom Line:
Regardless of whether the underlying engine is UCell or AUCell, you can immediately plot the results with FeatureDimPlot. Life is too short to wrangle metadata formats.
These chapters highlight modules that connect to Python-backed tools for regulatory network analysis, RNA velocity, fate mapping, and spatial applications, while still keeping the user experience consistent with the rest of the package.