6 Cell Type Annotation
After clustering, the natural next question is simple: what do these clusters actually represent? In practice, annotation usually combines two strategies. We first inspect clusters manually using known markers, and then we use a reference-based method to make the process faster, more systematic, and easier to reproduce.
This chapter introduces both perspectives. It keeps the biological intuition of manual annotation, while emphasizing the state-aware analysis interface that makes annotation results reusable in later steps.
6.1 Manual annotation
Please refer to the Cell cluster annotation session.
6.2 Automatic annotation
The low-level SingleR::SingleR() call is still useful for understanding the underlying method. In daily sclet workflows, however, the recommended entry point is RunSingleR(), because it records the annotation result and its provenance back into the unified state layer.
Alternatively, sclet also provides a lightweight reference mapping implementation via RunKNNPredict() (or RunReferenceMapping()), which transfers labels from a reference dataset to your query dataset based on KNN.
In this chapter, both the low-level SingleR() workflow and the sclet analysis examples are executed during book rendering when the required Bioconductor dependencies are available. This keeps the chapter useful as documentation while also exercising the annotation layer in CI.
6.2.1 Lightweight Reference Mapping (KNN)
If you have a reference SingleCellExperiment with cell type annotations, you can use it to map labels to your query dataset quickly:
set.seed(1)
ref_idx <- sample(seq_len(ncol(pbmc)), 500)
ref_sce <- pbmc[, ref_idx]
query_sce <- pbmc[, -ref_idx]

ref_sce$label <- as.character(SingleCellExperiment::colLabels(ref_sce))

query_sce <- RunKNNPredict(
    object = query_sce,
    ref = ref_sce,
    labels = "label",
    layer = "logcounts",
    k = 5,
    name = "knn_demo"
)

# Inspect the recorded reference-mapping state
get_mapping(query_sce)
## $id
## [1] "knn_demo"
##
## $type
## [1] "mapping"
##
## $status
## [1] "completed"
##
## $method
## [1] "KNNPredict"
##
## $inputs
## $inputs$assay
## [1] "logcounts"
##
## $inputs$layer
## [1] "logcounts"
##
## $inputs$features
## [1] 2000
##
## $inputs$k
## [1] 5
##
## $inputs$reference_class
## [1] "SingleCellExperiment"
##
## $inputs$mode
## [1] "label_transfer"
##
##
## $artifacts
## $artifacts$labels_col
## [1] "knn_demo_labels"
##
## $artifacts$score_col
## [1] "knn_demo_score"
##
## $artifacts$mapping_type
## [1] "knn_reference_mapping"
##
##
## $params
## list()
##
## $summary
## $summary$n_labels
## [1] 9
##
## $summary$n_reference_labels
## [1] 10
##
##
## $created_at
## [1] "2026-05-31 04:22:46 UTC"
6.2.2 Run SingleR with sclet
library(sclet)
hpca <- celldex::HumanPrimaryCellAtlasData()

pbmc2 <- RunSingleR(pbmc, ref = hpca, labels = hpca$label.main)

# explicitly choose the layer used for annotation
pbmc2 <- RunSingleR(pbmc, ref = hpca, labels = hpca$label.main, layer = "logcounts")

# inspect the recorded annotation state
get_annotation(pbmc2)
## $id
## [1] "singler"
##
## $type
## [1] "annotation"
##
## $status
## [1] "completed"
##
## $method
## [1] "SingleR"
##
## $inputs
## $inputs$assay
## [1] "logcounts"
##
## $inputs$layer
## [1] "logcounts"
##
## $inputs$reference_class
## [1] "SummarizedExperiment"
##
##
## $artifacts
## $artifacts$labels_col
## [1] "SingleR_labels"
##
## $artifacts$pruned_labels_col
## [1] "SingleR_pruned.labels"
##
##
## $params
## list()
##
## $summary
## list()
##
## $created_at
## [1] "2026-05-31 04:23:16 UTC"## $id
## [1] "singler"
##
## $type
## [1] "mapping"
##
## $status
## [1] "completed"
##
## $method
## [1] "SingleR"
##
## $inputs
## $inputs$assay
## [1] "logcounts"
##
## $inputs$layer
## [1] "logcounts"
##
## $inputs$reference_class
## [1] "SummarizedExperiment"
##
## $inputs$mode
## [1] "label_transfer"
##
##
## $artifacts
## $artifacts$labels_col
## [1] "SingleR_labels"
##
## $artifacts$mapping_type
## [1] "reference_mapping"
##
##
## $params
## list()
##
## $summary
## list()
##
## $created_at
## [1] "2026-05-31 04:23:16 UTC"6.2.3 Run SingleR
## class: SummarizedExperiment
## dim: 19363 713
## metadata(0):
## assays(1): logcounts
## rownames(19363): A1BG A1BG-AS1 ... ZZEF1 ZZZ3
## rowData names(0):
## colnames(713): GSM112490 GSM112491 ... GSM92233
##   GSM92234
## colData names(3): label.main label.fine label.ont
res <- SingleR::SingleR(
test = SummarizedExperiment::assay(pbmc, "logcounts"),
ref = hpca,
labels = hpca$label.main
)
head(res)## DataFrame with 6 rows and 4 columns
## scores labels delta.next
## <matrix> <character> <numeric>
## 1 0.1040907:0.233575:0.222844:... T_cells 0.0888618
## 2 0.1017499:0.358524:0.299235:... B_cell 0.3046119
## 3 0.0696533:0.265561:0.237793:... T_cells 0.1985708
## 4 0.0863639:0.235842:0.275857:... Monocyte 0.0503585
## 5 0.0737555:0.164465:0.175442:... NK_cell 0.0892196
## 6 0.1281878:0.258801:0.249245:... T_cells 0.0775251
## pruned.labels
## <character>
## 1 T_cells
## 2 B_cell
## 3 T_cells
## 4 Monocyte
## 5 NK_cell
## 6 T_cellsdice <- celldex::DatabaseImmuneCellExpressionData()
res2 <- SingleR::SingleR(
test = SummarizedExperiment::assay(pbmc, "logcounts"),
ref = dice,
labels = dice$label.main
)
head(res2)## DataFrame with 6 rows and 4 columns
## scores labels
## <matrix> <character>
## 1 0.01278759:0.0594162:0.1731098:... T cells, CD4+
## 2 0.26468267:0.1424061:0.0667195:... B cells
## 3 0.03184648:0.0768767:0.2039776:... T cells, CD4+
## 4 -0.00914745:0.3439882:0.0610696:... Monocytes
## 5 -0.04285154:0.0396558:0.2513840:... NK cells
## 6 0.06123675:0.0980547:0.1470082:... T cells, CD4+
## delta.next pruned.labels
## <numeric> <character>
## 1 0.00808206 T cells, CD4+
## 2 0.12227658 B cells
## 3 0.05825145 T cells, CD4+
## 4 0.28291862 Monocytes
## 5 0.15577995 NK cells
## 6 0.12673642 T cells, CD4+When you use the low-level SingleR() call directly, you are responsible for deciding which matrix to pass. In contrast, RunSingleR() follows the current sclet layer contract and resolves that choice from DefaultLayer(pbmc) unless you override it.
If the current layer comes from a corrected integration workflow, both the annotation state and the mapping state record that provenance. In practice, this means get_annotation(pbmc)$inputs$integration and get_mapping(pbmc)$inputs$integration can tell you whether the label transfer was performed on top of a corrected representation rather than the raw normalized layer.
6.2.5 Comparision with manual annotation result
# Ensure manual labels are available in colData for comparison
pbmc$label <- SingleCellExperiment::colLabels(pbmc)

x <- colData(pbmc)[, c("label", "hpca_label", "dice_label")]

plot_list(
    manual = sc_dim(pbmc, reduction="UMAP"),
    hpca = sc_dim(pbmc, reduction="UMAP", mapping=aes(color=hpca_label)),
    dice = sc_dim(pbmc, reduction="UMAP", mapping=aes(color=dice_label)),
    ncol = 3) &
sc_dim_geom_label(geom = ggrepel::geom_text_repel) &
theme(legend.position='inside')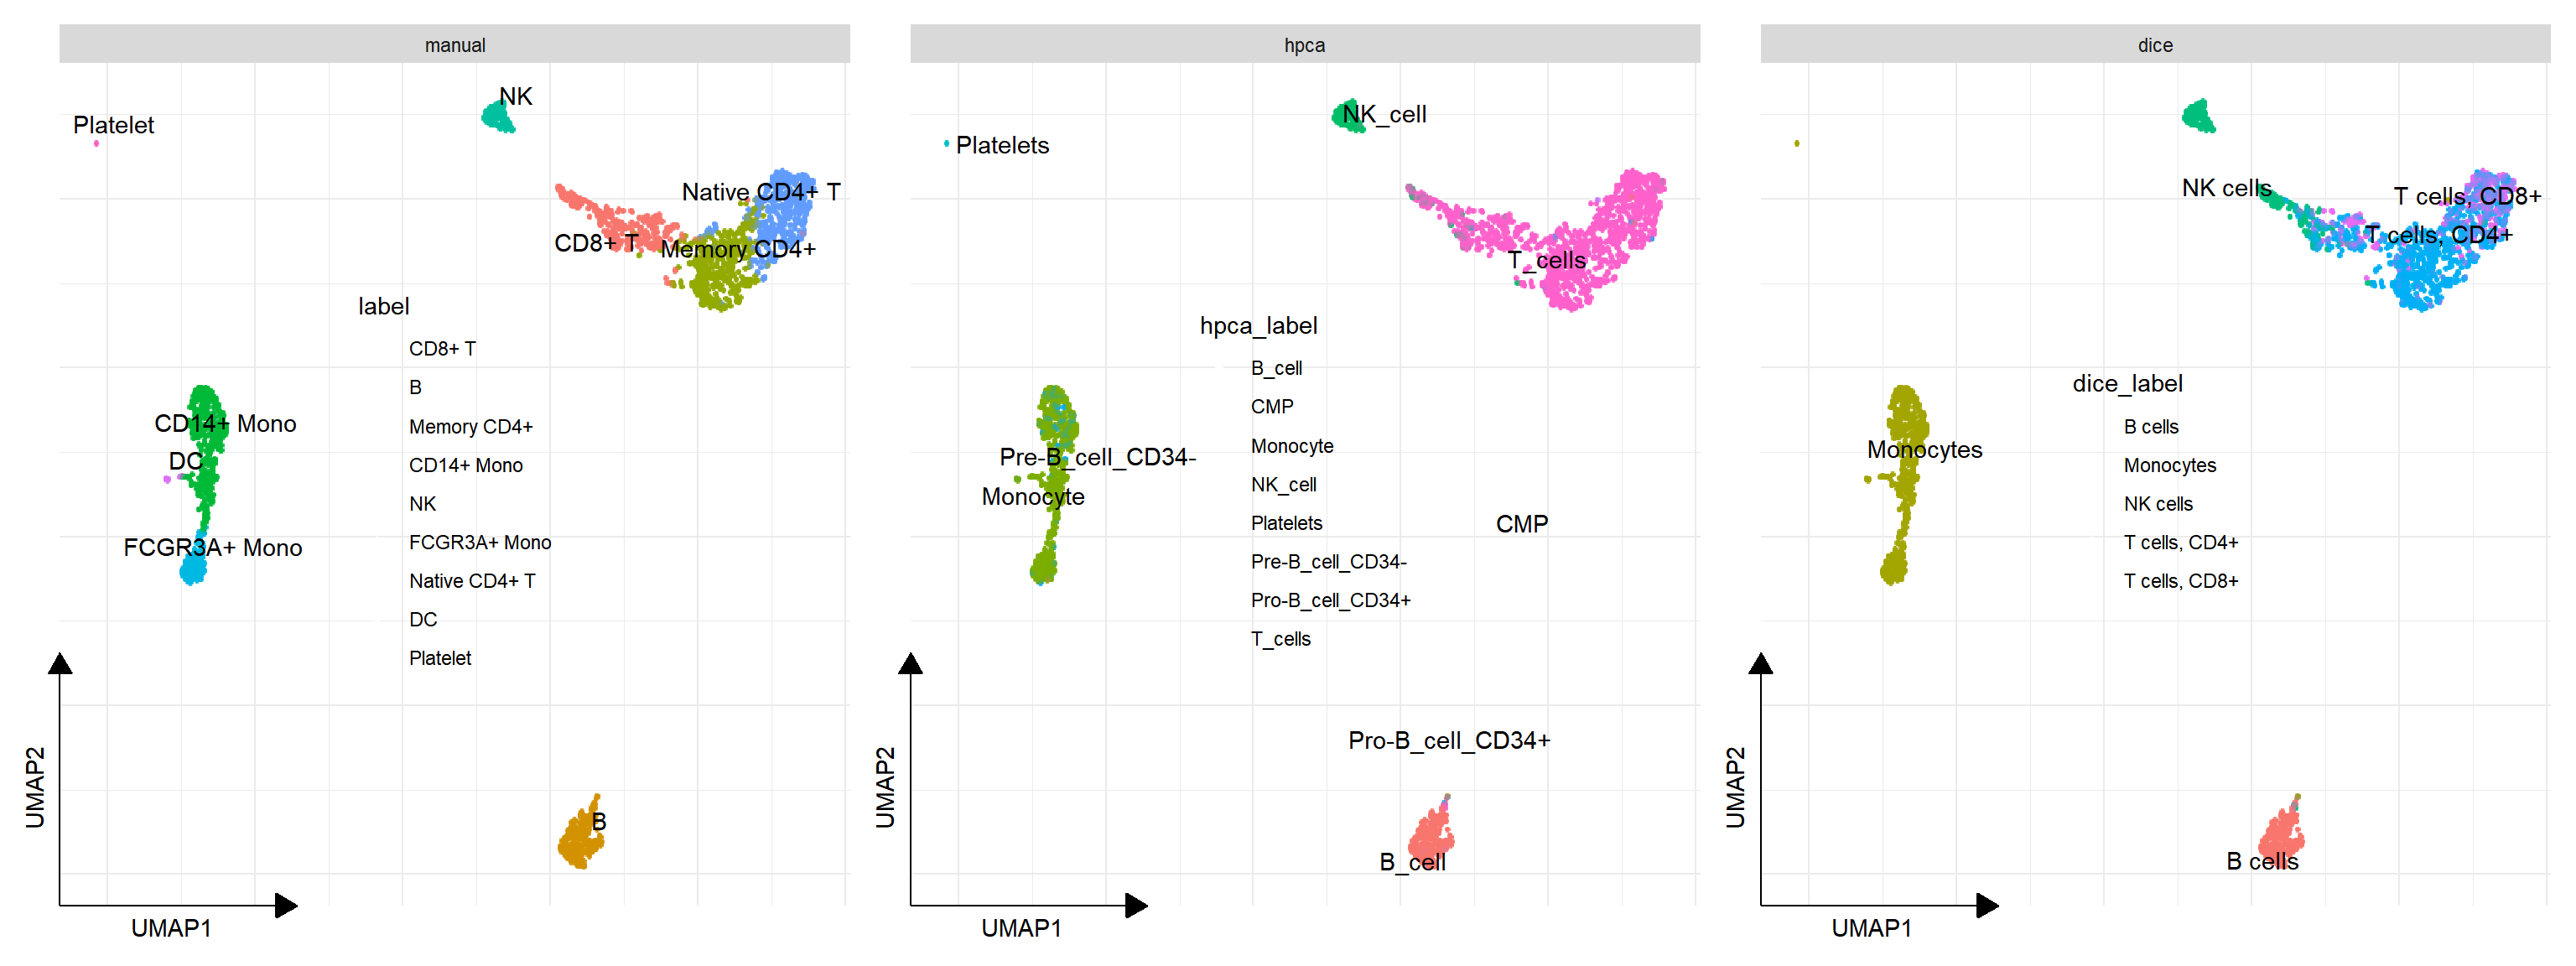
##      hpca_label
## label B_cell CMP Monocyte NK_cell Platelets
##    1       0   0        0       1         0
##    2     333   0        0       0         0
##    3       0   2      391       0         0
##    4       0   0        0     149         0
##    5       0   0        0      32         0
##    6       0   0        0       6         0
##    7       0   0      148       0         0
##    8       0   2        0       1         0
##    9       0   0       78       0         0
##    10      0   0        0       0        12
##      hpca_label
## label Pre-B_cell_CD34- Pro-B_cell_CD34+ T_cells
##    1                 1                0     477
##    2                 1                4       5
##    3                36                0       1
##    4                 0                0       4
##    5                 1                0     232
##    6                 3                0     159
##    7                 7                0       1
##    8                 1                0     536
##    9                13                0       0
## 10 0 1 0## dice_label
## label B cells Monocytes NK cells T cells, CD4+
## 1 0 0 5 440
## 2 340 0 1 1
## 3 0 429 0 1
## 4 0 0 152 1
## 5 0 0 153 89
## 6 0 0 21 97
## 7 0 156 0 0
## 8 0 2 0 296
## 9 0 91 0 0
## 10 0 13 0 0
## dice_label
## label T cells, CD8+
## 1 34
## 2 1
## 3 0
## 4 0
## 5 23
## 6 50
## 7 0
## 8 242
## 9 0
## 10 0The chapters here cover differential expression, pseudobulk strategies, enrichment analysis, and gene set scoring. Together, they show how sclet supports not only convenient workflows, but also more careful and interpretable downstream inference.