17 Useful utilities
17.1 Translating Biological ID
17.1.1 bitr: Biological Id TranslatoR
The clusterProfiler package provides the bitr() and bitr_kegg() functions for converting ID types. Both bitr() and bitr_kegg() support many species including model and many non-model organisms.
x <- c("GPX3",  "GLRX",   "LBP",   "CRYAB", "DEFB1", "HCLS1",   "SOD2",   "HSPA2",
       "ORM1",  "IGFBP1", "PTHLH", "GPC3",  "IGFBP3","TOB1",    "MITF",   "NDRG1",
       "NR1H4", "FGFR3",  "PVR",   "IL6",   "PTPRM", "ERBB2",   "NID2",   "LAMB1",
       "COMP",  "PLS3",   "MCAM",  "SPP1",  "LAMC1", "COL4A2",  "COL4A1", "MYOC",
       "ANXA4", "TFPI2",  "CST6",  "SLPI",  "TIMP2", "CPM",     "GGT1",   "NNMT",
       "MAL",   "EEF1A2", "HGD",   "TCN2",  "CDA",   "PCCA",    "CRYM",   "PDXK",
       "STC1",  "WARS",  "HMOX1", "FXYD2", "RBP4",   "SLC6A12", "KDELR3", "ITM2B")
eg = bitr(x, fromType="SYMBOL", toType="ENTREZID", OrgDb="org.Hs.eg.db")
head(eg)
## SYMBOL ENTREZID
## 1 GPX3 2878
## 2 GLRX 2745
## 3 LBP 3929
## 4 CRYAB 1410
## 5 DEFB1 1672
## 6 HCLS1 3059User should provides an annotation package, both fromType and toType can accept any types that supported.
User can use keytypes to list all supporting types.
##  [1] "ACCNUM"       "ALIAS"        "ENSEMBL"      "ENSEMBLPROT"  "ENSEMBLTRANS"
##  [6] "ENTREZID"     "ENZYME"       "EVIDENCE"     "EVIDENCEALL"  "GENENAME"
## [11] "GENETYPE"     "GO"           "GOALL"        "IPI"          "MAP"
## [16] "OMIM"         "ONTOLOGY"     "ONTOLOGYALL"  "PATH"         "PFAM"
## [21] "PMID"         "PROSITE"      "REFSEQ"       "SYMBOL"       "UCSCKG"
## [26] "UNIPROT"
We can translate from one type to other types.
## Warning in bitr(x, fromType = "SYMBOL", toType = c("UNIPROT", "ENSEMBL"), :
## 1.79% of input gene IDs are fail to map...
head(ids)## SYMBOL UNIPROT ENSEMBL
## 1 GPX3 P22352 ENSG00000211445
## 2 GLRX A0A024RAM2 ENSG00000173221
## 3 GLRX P35754 ENSG00000173221
## 4 LBP P18428 ENSG00000129988
## 5 LBP Q8TCF0 ENSG00000129988
## 6 CRYAB P02511 ENSG00000109846For GO analysis, user don’t need to convert ID, all ID type provided by OrgDb can be used in groupGO, enrichGO and gseGO by specifying keyType parameter.
Users can use the bitr function to convert IDs using any ID types that available in the OrbDb object. For example, users may want to know the genes in background that are belong to a specific GO term. Such information can be easily accessed using bitr.
## [1] 114 4
head(m)## GO EVIDENCE ONTOLOGY SYMBOL
## 1 GO:0006805 TAS BP NAT1
## 2 GO:0006805 TAS BP NAT2
## 3 GO:0006805 TAS BP AADAC
## 4 GO:0006805 TAS BP AHR
## 5 GO:0006805 TAS BP ALDH3A1
## 6 GO:0006805 TAS BP AOC2Note: If you want to extract genes in your input gene list that are belong to a specific term/pathway, you can use the geneInCategory function.
17.1.2 bitr_kegg: converting biological IDs using KEGG API
## [1] "4597" "7111" "5266" "2175" "755" "23046"
eg2np <- bitr_kegg(hg, fromType='kegg', toType='ncbi-proteinid', organism='hsa')## Warning in bitr_kegg(hg, fromType = "kegg", toType = "ncbi-proteinid", organism
## = "hsa"): 4.17% of input gene IDs are fail to map...
head(eg2np)## kegg ncbi-proteinid
## 1 10001 NP_005457
## 2 10209 NP_005792
## 3 10232 NP_037536
## 4 10324 NP_006054
## 5 10411 NP_001092002
## 6 10614 NP_006451The ID type (both fromType & toType) should be one of ‘kegg’, ‘ncbi-geneid’, ‘ncbi-proteinid’ or ‘uniprot’. The ‘kegg’ is the primary ID used in KEGG database. The data source of KEGG was from NCBI. A rule of thumb for the ‘kegg’ ID is entrezgene ID for eukaryote species and Locus ID for prokaryotes.
Many prokaryote species don’t have entrezgene ID available. For example we can check the gene information of ece:Z5100 in http://www.genome.jp/dbget-bin/www_bget?ece:Z5100, which have NCBI-ProteinID and UnitProt links in the Other DBs Entry, but not NCBI-GeneID.
If we try to convert Z5100 to ncbi-geneid, bitr_kegg will throw error of ncbi-geneid is not supported.
bitr_kegg("Z5100", fromType="kegg", toType='ncbi-geneid', organism='ece')

## Error in KEGG_convert(fromType, toType, organism) :
## ncbi-geneid is not supported for ece ...
We can of course convert it to ncbi-proteinid and uniprot:
bitr_kegg("Z5100", fromType="kegg", toType='ncbi-proteinid', organism='ece')## kegg ncbi-proteinid
## 1 Z5100 AAG58814
bitr_kegg("Z5100", fromType="kegg", toType='uniprot', organism='ece')## kegg uniprot
## 1 Z5100 A0A4P8B4C9
17.2 setReadable: translating gene IDs to human readable symbols
Some of the functions, especially those internally supported for DO, GO, and Reactome Pathway, support a parameter, readable. If readable = TRUE, all the gene IDs will be translated to gene symbols. The readable parameter is not available for enrichment analysis of KEGG or using user’s own annotation. KEGG analysis using enrichKEGG and gseKEGG, which internally query annotation information from KEEGG database and thus support all species if it is available in the KEGG database. However, KEGG database doesn’t provide gene ID to symbol mapping information. For analysis using user’s own annotation data, we even don’t know what species is in analyzed. Translating gene IDs to gene symbols is partly supported using the setReadable function if and only if there is an OrgDb available. The setReadable() function also works with compareCluster() output.
library(org.Hs.eg.db)
library(clusterProfiler)

data(geneList, package="DOSE")
de <- names(geneList)[1:100]
x <- enrichKEGG(de)
## The geneID column is ENTREZID
head(x, 3)
## ID Description GeneRatio BgRatio pvalue
## hsa04110 hsa04110 Cell cycle 8/47 126/8142 4.990001e-07
## hsa04218 hsa04218 Cellular senescence 7/47 156/8142 2.737780e-05
## hsa04114 hsa04114 Oocyte meiosis 6/47 131/8142 9.667769e-05
## p.adjust qvalue geneID Count
## hsa04110 5.988001e-05 5.462738e-05 8318/991/9133/890/983/4085/7272/1111 8
## hsa04218 1.642668e-03 1.498574e-03 2305/4605/9133/890/983/51806/1111 7
## hsa04114 3.867107e-03 3.527888e-03 991/9133/983/4085/51806/6790 6
y <- setReadable(x, OrgDb = org.Hs.eg.db, keyType="ENTREZID")
## The geneID column is translated to symbol
head(y, 3)
## ID Description GeneRatio BgRatio pvalue
## hsa04110 hsa04110 Cell cycle 8/47 126/8142 4.990001e-07
## hsa04218 hsa04218 Cellular senescence 7/47 156/8142 2.737780e-05
## hsa04114 hsa04114 Oocyte meiosis 6/47 131/8142 9.667769e-05
## p.adjust qvalue
## hsa04110 5.988001e-05 5.462738e-05
## hsa04218 1.642668e-03 1.498574e-03
## hsa04114 3.867107e-03 3.527888e-03
## geneID Count
## hsa04110 CDC45/CDC20/CCNB2/CCNA2/CDK1/MAD2L1/TTK/CHEK1 8
## hsa04218 FOXM1/MYBL2/CCNB2/CCNA2/CDK1/CALML5/CHEK1 7
## hsa04114 CDC20/CCNB2/CDK1/MAD2L1/CALML5/AURKA 6For those functions that internally support readable parameter, user can also use setReadable for translating gene IDs.
17.3 Parsing GMT files
The GMT (Gene Matrix Transposed) file format is a tab delimited file format that is widely used to describe gene sets. Each row in the GMT format represents one gene set and each gene set is described by a name (or ID), a description and the genes in the gene set as illustrated in Figure 17.1.
Figure 17.1: The GMT format. Figure taken from https://software.broadinstitute.org/cancer/software/gsea/wiki/index.php/Data_formats.
The clusterProfiler package implemented a function, read.gmt(), to parse GMT file into a data.frame. The WikiPathway GMT file encodes information of version, wpid and species into the Description column. The clusterProfiler provides the read.gmt.wp() function to parse WikiPathway GMT file and supports parsing information that encoded in the Description column.
url <- "https://maayanlab.cloud/Enrichr/geneSetLibrary?mode=text&libraryName=COVID-19_Related_Gene_Sets"
download.file(url, destfile = "COVID19_GeneSets.gmt")
covid19_gs <- read.gmt("COVID19_GeneSets.gmt")
head(covid19_gs)
## term gene
## 1 COVID19-E protein host PPI from Krogan BRD4
## 2 COVID19-E protein host PPI from Krogan BRD2
## 3 COVID19-E protein host PPI from Krogan SLC44A2
## 4 COVID19-E protein host PPI from Krogan ZC3H18
## 5 COVID19-E protein host PPI from Krogan AP3B1
## 6 COVID19-E protein host PPI from Krogan CWC27Gene set resources:
There are many gene sets available online. After parsing by the read.gmt() function, the data can be directly used to perform enrichment analysis using enricher() and GSEA() functions (see also Chapter 12).
17.4 GO utilities
17.4.1 drop specific GO terms or level
The enrichGO() function tests the whole GO corpus and enriched result may contains very general terms. With dropGO function, user can remove specific GO terms or GO level from results obtained from both enrichGO() and compareCluster().
17.4.2 test GO at sepcific level
The enrichGO() doesn’t contain parameter to restrict the test at specific GO level. Instead, we provide a function, gofilter(), to restrict the result at specific GO level. It works with results obtained from both enrichGO() and compareCluster().
17.4.3 reduce redundancy of enriched GO terms
GO is organized in parent-child structure, thus a parent term can be overlapped with a large proportion with all its child terms. This can result in redundant findings. To solve this issue, clusterProfiler implements simplify method to reduce redundant GO terms from the outputs of enrichGO() and gseGO(). The function internally called GOSemSim (Yu et al. 2010) to calculate semantic similarity among GO terms and remove those highly similar terms by keeping one representative term. The simplify() method apply select_fun (which can be a user defined function) to feature by to select one representative term from redundant terms (which have similarity higher than cutoff).
In Figure 17.2A, we can found that there are many redundant terms form a highly condense network. After removing redundant terms using the simplify() method, the result is more clear to view the whole story.
data(geneList, package="DOSE")
de <- names(geneList)[abs(geneList) > 2]
bp <- enrichGO(de, ont="BP", OrgDb = 'org.Hs.eg.db')
bp <- pairwise_termsim(bp)
bp2 <- simplify(bp, cutoff=0.7, by="p.adjust", select_fun=min)
p1 <- emapplot(bp)
p2 <- emapplot(bp2)
cowplot::plot_grid(p1, p2, ncol=2, labels = LETTERS[1:2])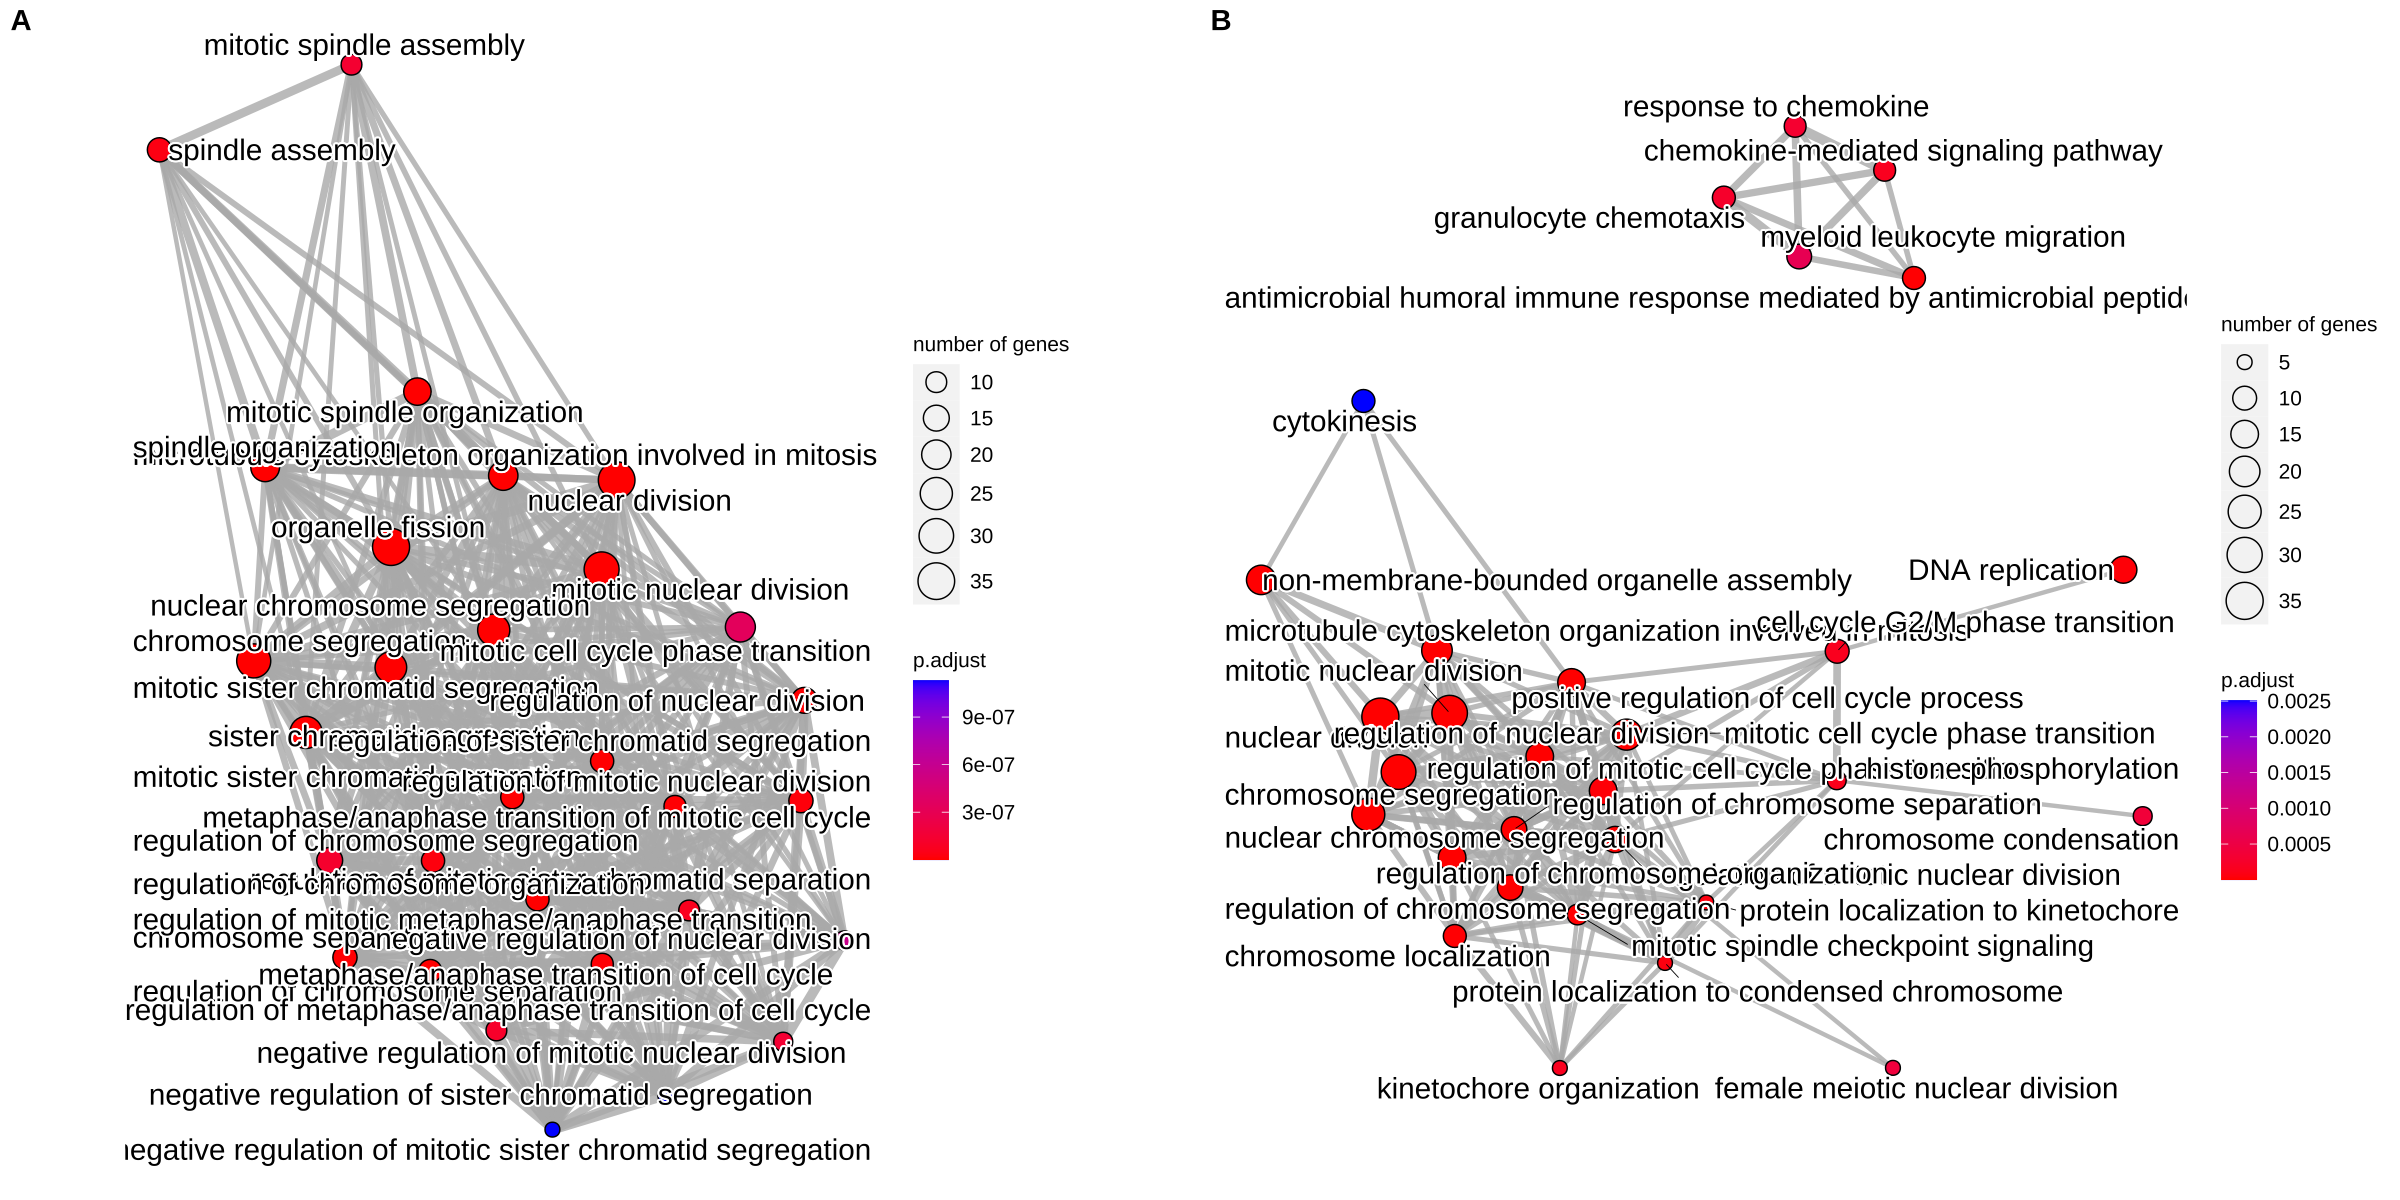
Figure 17.2: Visualize enriched terms by EnrichmentMap using the emapplot() function. (A) original result. (B) simplify result.
Alternatively, users can use slim version of GO and use the enricher() o r gseGO() functions to analyze.