6 GO enrichment analysis
GO comprises three orthogonal ontologies, i.e. molecular function (MF), biological process (BP), and cellular component (CC).
6.1 Supported organisms
GO analyses (groupGO(), enrichGO() and gseGO()) support organisms that have an OrgDb object available (see also session 2.2).
If a user has GO annotation data (in a data.frame format with the first column as gene ID and the second column as GO ID), they can use the enricher() and GSEA() functions to perform an over-representation test and gene set enrichment analysis.
If the genes are annotated by direction annotation, they should also be annotated by their ancestor GO nodes (indirect annotation). If a user only has direct annotation, they can pass their annotation to the buildGOmap function, which will infer indirect annotation and generate a data.frame that is suitable for both enricher() and GSEA().
6.2 GO classification
In clusterProfiler, the groupGO() function is designed for gene classification based on GO distribution at a specific level. Here we use the dataset geneList provided by DOSE.
library(clusterProfiler)
data(geneList, package="DOSE")
gene <- names(geneList)[abs(geneList) > 2]

# Entrez gene ID
head(gene)
## [1] "4312" "8318" "10874" "55143" "55388" "991"## ID Description Count GeneRatio geneID
## GO:0000133 GO:0000133 polarisome 0 0/207
## GO:0000408 GO:0000408 EKC/KEOPS complex 0 0/207
## GO:0000417 GO:0000417 HIR complex 0 0/207
## GO:0000444 GO:0000444 MIS12/MIND type complex 0 0/207
## GO:0000808 GO:0000808 origin recognition complex 0 0/207
## GO:0000930 GO:0000930 gamma-tubulin complex 0 0/207The gene parameter is a vector of gene IDs (can be any ID type that is supported by the corresponding OrgDb, see also session 16.1). If readable is set to TRUE, the input gene IDs will be converted to gene symbols.
6.3 GO over-representation analysis
The clusterProfiler package implements enrichGO() for gene ontology over-representation test.
ego <- enrichGO(gene          = gene,
                universe      = names(geneList),
                OrgDb         = org.Hs.eg.db,
                ont           = "CC",
                pAdjustMethod = "BH",
                pvalueCutoff  = 0.01,
                qvalueCutoff  = 0.05,
        readable      = TRUE)
head(ego)
## ID Description GeneRatio
## GO:0005819 GO:0005819 spindle 26/201
## GO:0000779 GO:0000779 condensed chromosome, centromeric region 16/201
## GO:0072686 GO:0072686 mitotic spindle 17/201
## GO:0000775 GO:0000775 chromosome, centromeric region 18/201
## GO:0098687 GO:0098687 chromosomal region 23/201
## GO:0000776 GO:0000776 kinetochore 15/201
## BgRatio pvalue p.adjust qvalue
## GO:0005819 306/11853 1.072029e-11 3.151766e-09 2.888837e-09
## GO:0000779 114/11853 7.709944e-11 8.659125e-09 7.936756e-09
## GO:0072686 133/11853 8.835841e-11 8.659125e-09 7.936756e-09
## GO:0000775 158/11853 1.684987e-10 1.179661e-08 1.081250e-08
## GO:0098687 272/11853 2.006225e-10 1.179661e-08 1.081250e-08
## GO:0000776 106/11853 2.733425e-10 1.339378e-08 1.227644e-08
## geneID
## GO:0005819 CDCA8/CDC20/KIF23/CENPE/ASPM/DLGAP5/SKA1/NUSAP1/TPX2/TACC3/NEK2/CDK1/MAD2L1/KIF18A/BIRC5/KIF11/TRAT1/TTK/AURKB/PRC1/KIFC1/KIF18B/KIF20A/AURKA/CCNB1/KIF4A
## GO:0000779 CENPE/NDC80/HJURP/SKA1/NEK2/CENPM/CENPN/ERCC6L/MAD2L1/KIF18A/CDT1/BIRC5/TTK/NCAPG/AURKB/CCNB1
## GO:0072686 KIF23/CENPE/ASPM/SKA1/NUSAP1/TPX2/TACC3/CDK1/MAD2L1/KIF18A/KIF11/TRAT1/AURKB/PRC1/KIFC1/KIF18B/AURKA
## GO:0000775 CDCA8/CENPE/NDC80/TOP2A/HJURP/SKA1/NEK2/CENPM/CENPN/ERCC6L/MAD2L1/KIF18A/CDT1/BIRC5/TTK/NCAPG/AURKB/CCNB1
## GO:0098687 CDCA8/CENPE/NDC80/TOP2A/HJURP/SKA1/NEK2/CENPM/RAD51AP1/CENPN/CDK1/ERCC6L/MAD2L1/KIF18A/CDT1/BIRC5/EZH2/TTK/NCAPG/AURKB/CHEK1/CCNB1/MCM5
## GO:0000776 CENPE/NDC80/HJURP/SKA1/NEK2/CENPM/CENPN/ERCC6L/MAD2L1/KIF18A/CDT1/BIRC5/TTK/AURKB/CCNB1
## Count
## GO:0005819 26
## GO:0000779 16
## GO:0072686 17
## GO:0000775 18
## GO:0098687 23
## GO:0000776 15Any gene ID type that is supported in OrgDb can be directly used in GO analyses. Users need to specify the keyType parameter to specify the input gene ID type.
gene.df <- bitr(gene, fromType = "ENTREZID",
        toType = c("ENSEMBL", "SYMBOL"),
        OrgDb = org.Hs.eg.db)

ego2 <- enrichGO(gene         = gene.df$ENSEMBL,
                OrgDb         = org.Hs.eg.db,
                keyType       = 'ENSEMBL',
                ont           = "CC",
                pAdjustMethod = "BH",
                pvalueCutoff  = 0.01,
                qvalueCutoff  = 0.05)
head(ego2, 3)
## ID Description GeneRatio
## GO:0005819 GO:0005819 spindle 30/233
## GO:0072686 GO:0072686 mitotic spindle 21/233
## GO:0000779 GO:0000779 condensed chromosome, centromeric region 17/233
## BgRatio pvalue p.adjust qvalue
## GO:0005819 422/21916 1.954166e-16 5.413039e-14 4.175744e-14
## GO:0072686 179/21916 3.911063e-16 5.416822e-14 4.178662e-14
## GO:0000779 154/21916 7.525516e-13 6.948560e-11 5.360280e-11
## geneID
## GO:0005819 ENSG00000134690/ENSG00000117399/ENSG00000137807/ENSG00000138778/ENSG00000066279/ENSG00000126787/ENSG00000154839/ENSG00000262634/ENSG00000137804/ENSG00000088325/ENSG00000013810/ENSG00000117650/ENSG00000170312/ENSG00000164109/ENSG00000121621/ENSG00000089685/ENSG00000138160/ENSG00000163519/ENSG00000112742/ENSG00000178999/ENSG00000198901/ENSG00000237649/ENSG00000233450/ENSG00000056678/ENSG00000204197/ENSG00000186185/ENSG00000112984/ENSG00000087586/ENSG00000134057/ENSG00000090889
## GO:0072686 ENSG00000137807/ENSG00000138778/ENSG00000066279/ENSG00000154839/ENSG00000262634/ENSG00000137804/ENSG00000088325/ENSG00000013810/ENSG00000170312/ENSG00000164109/ENSG00000121621/ENSG00000138160/ENSG00000163519/ENSG00000178999/ENSG00000198901/ENSG00000237649/ENSG00000233450/ENSG00000056678/ENSG00000204197/ENSG00000186185/ENSG00000087586
## GO:0000779 ENSG00000138778/ENSG00000080986/ENSG00000123485/ENSG00000154839/ENSG00000262634/ENSG00000117650/ENSG00000100162/ENSG00000166451/ENSG00000186871/ENSG00000164109/ENSG00000121621/ENSG00000167513/ENSG00000089685/ENSG00000112742/ENSG00000109805/ENSG00000178999/ENSG00000134057
## Count
## GO:0005819 30
## GO:0072686 21
## GO:0000779 17Gene IDs can be mapped to gene Symbols by using the parameter readable=TRUE or setReadable() function.
6.4 GO Gene Set Enrichment Analysis
The clusterProfiler package provides the gseGO() function for gene set enrichment analysis using gene ontology.
ego3 <- gseGO(geneList     = geneList,
              OrgDb        = org.Hs.eg.db,
              ont          = "CC",
              minGSSize    = 100,
              maxGSSize    = 500,
              pvalueCutoff = 0.05,
              verbose      = FALSE)
The format of input data, geneList, was documented in the FAQ. Beware that only gene Set size in [minGSSize, maxGSSize] will be tested.
6.5 GO analysis for non-model organisms
Both the enrichGO() and gseGO() functions require an OrgDb object as the background annotation. For organisms that don’t have OrgDb provided by Bioconductor, users can query one (if available) online via AnnotationHub. If there is no OrgDb available, users can obtain GO annotation from other sources, e.g. from biomaRt or Blast2GO. Then the enricher() or GSEA() functions can be used to perform GO analysis for these organisms, similar to the examples using wikiPathways and MSigDB. Another solution is to create an OrgDb on your own using AnnotationForge package.
6.6 Visualize enriched GO terms as a directed acyclic graph
The goplot() function can accept the output of enrichGO and visualize the enriched GO induced graph.
goplot(ego)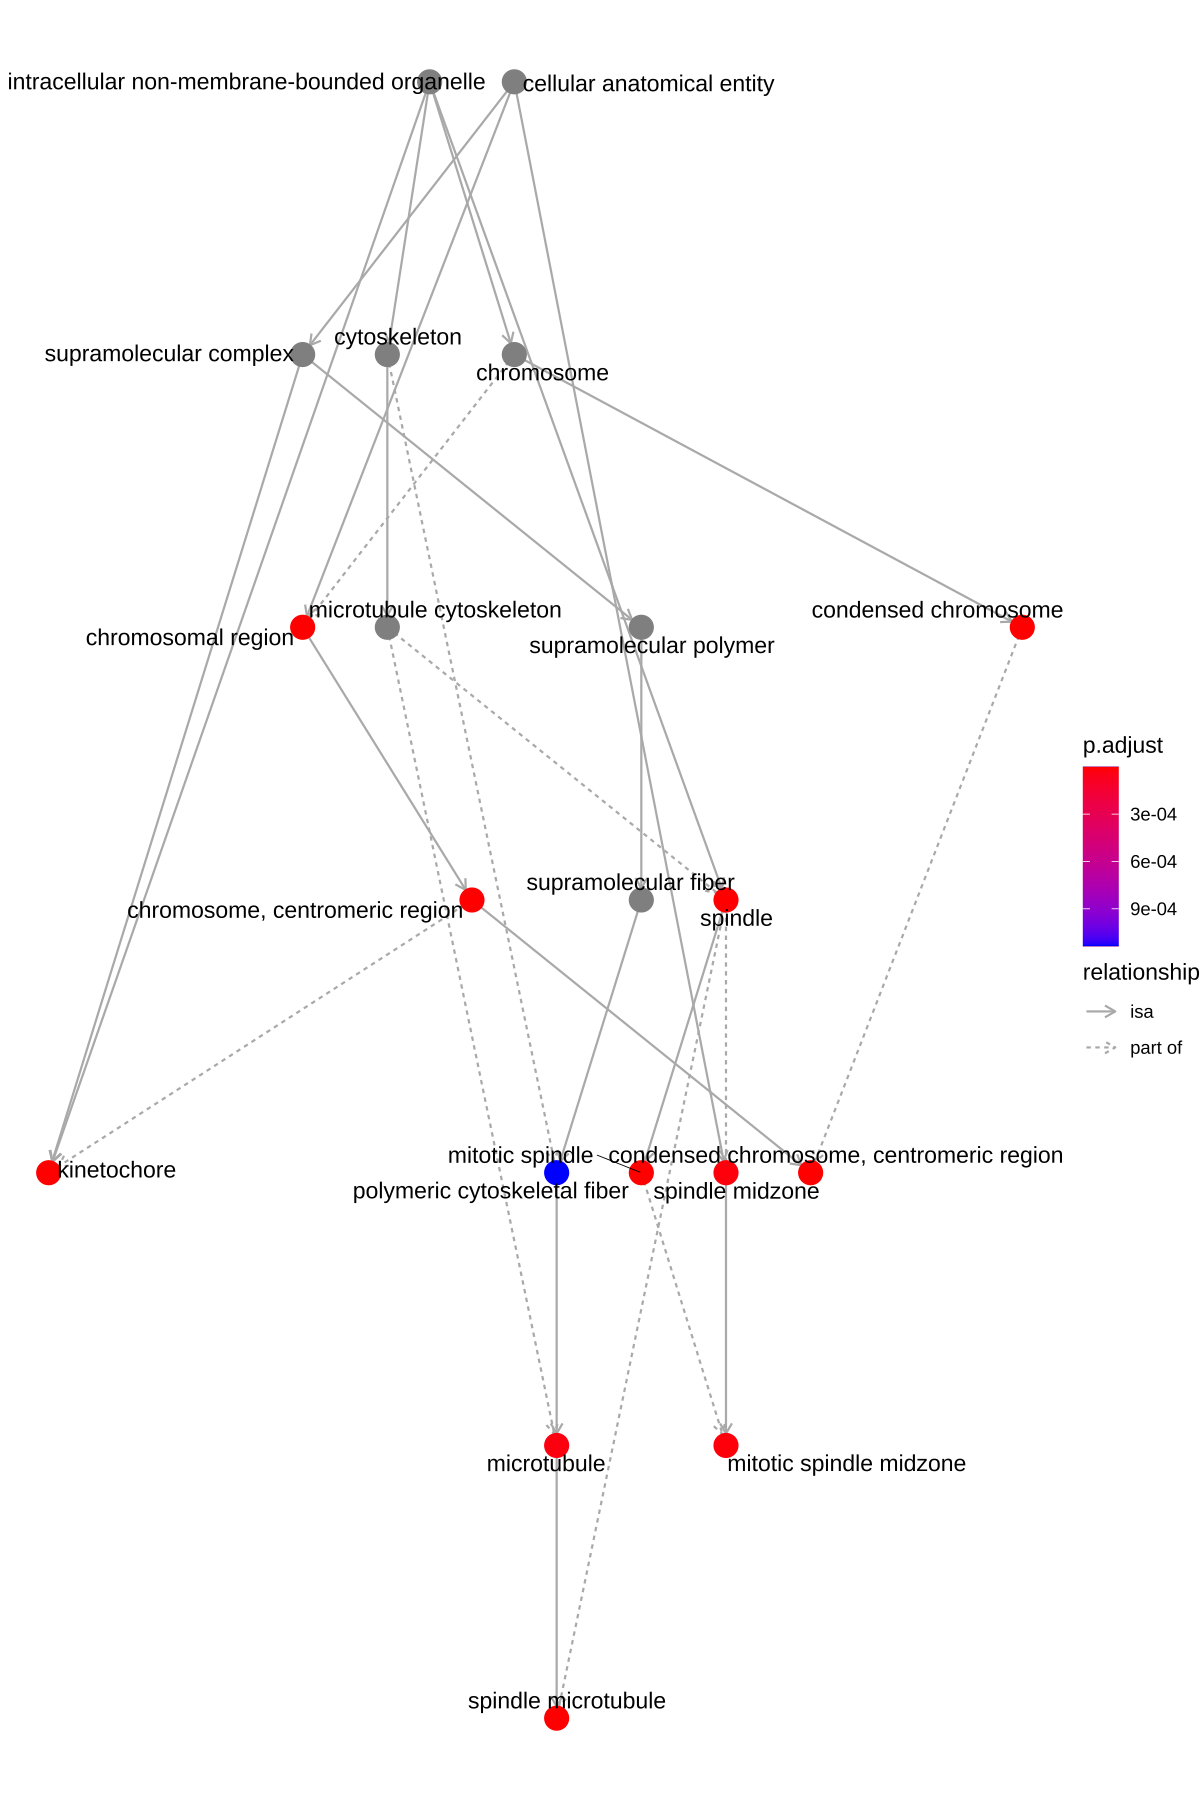
Figure 6.1: Goplot of enrichment analysis.
6.7 Summary
GO semantic similarity can be calculated by GOSemSim (Yu et al. 2010). We can use it to cluster genes/proteins into different clusters based on their functional similarity and can also use it to measure the similarities among GO terms to reduce the redundancy of GO enrichment results.