4 Slingshot: cell lineage and pseudotime inference
pancreas <- readRDS("data/pancreas_sub_sce.rds")

panc <- RunSlingshot(sce = pancreas, group = "SubCellType", reduction = "UMAP")
4.1 Lineage plot
p1 <- lineage_plot(panc, group = "SubCellType") +
  sc_dim_geom_label(
    geom = shadowtext::geom_shadowtext,
    color='black',
    bg.color='white'
  )


## displayed selected lineages
p2 <- lineage_plot(panc, group = "SubCellType", lineages = c("Lineage1", "Lineage2"))  +
  sc_dim_geom_label(
    geom = shadowtext::geom_shadowtext,
    color='black',
    bg.color='white'
  )

plot_list(`All Lineages` = p1, `Selected Lineages` = p2, ncol=1)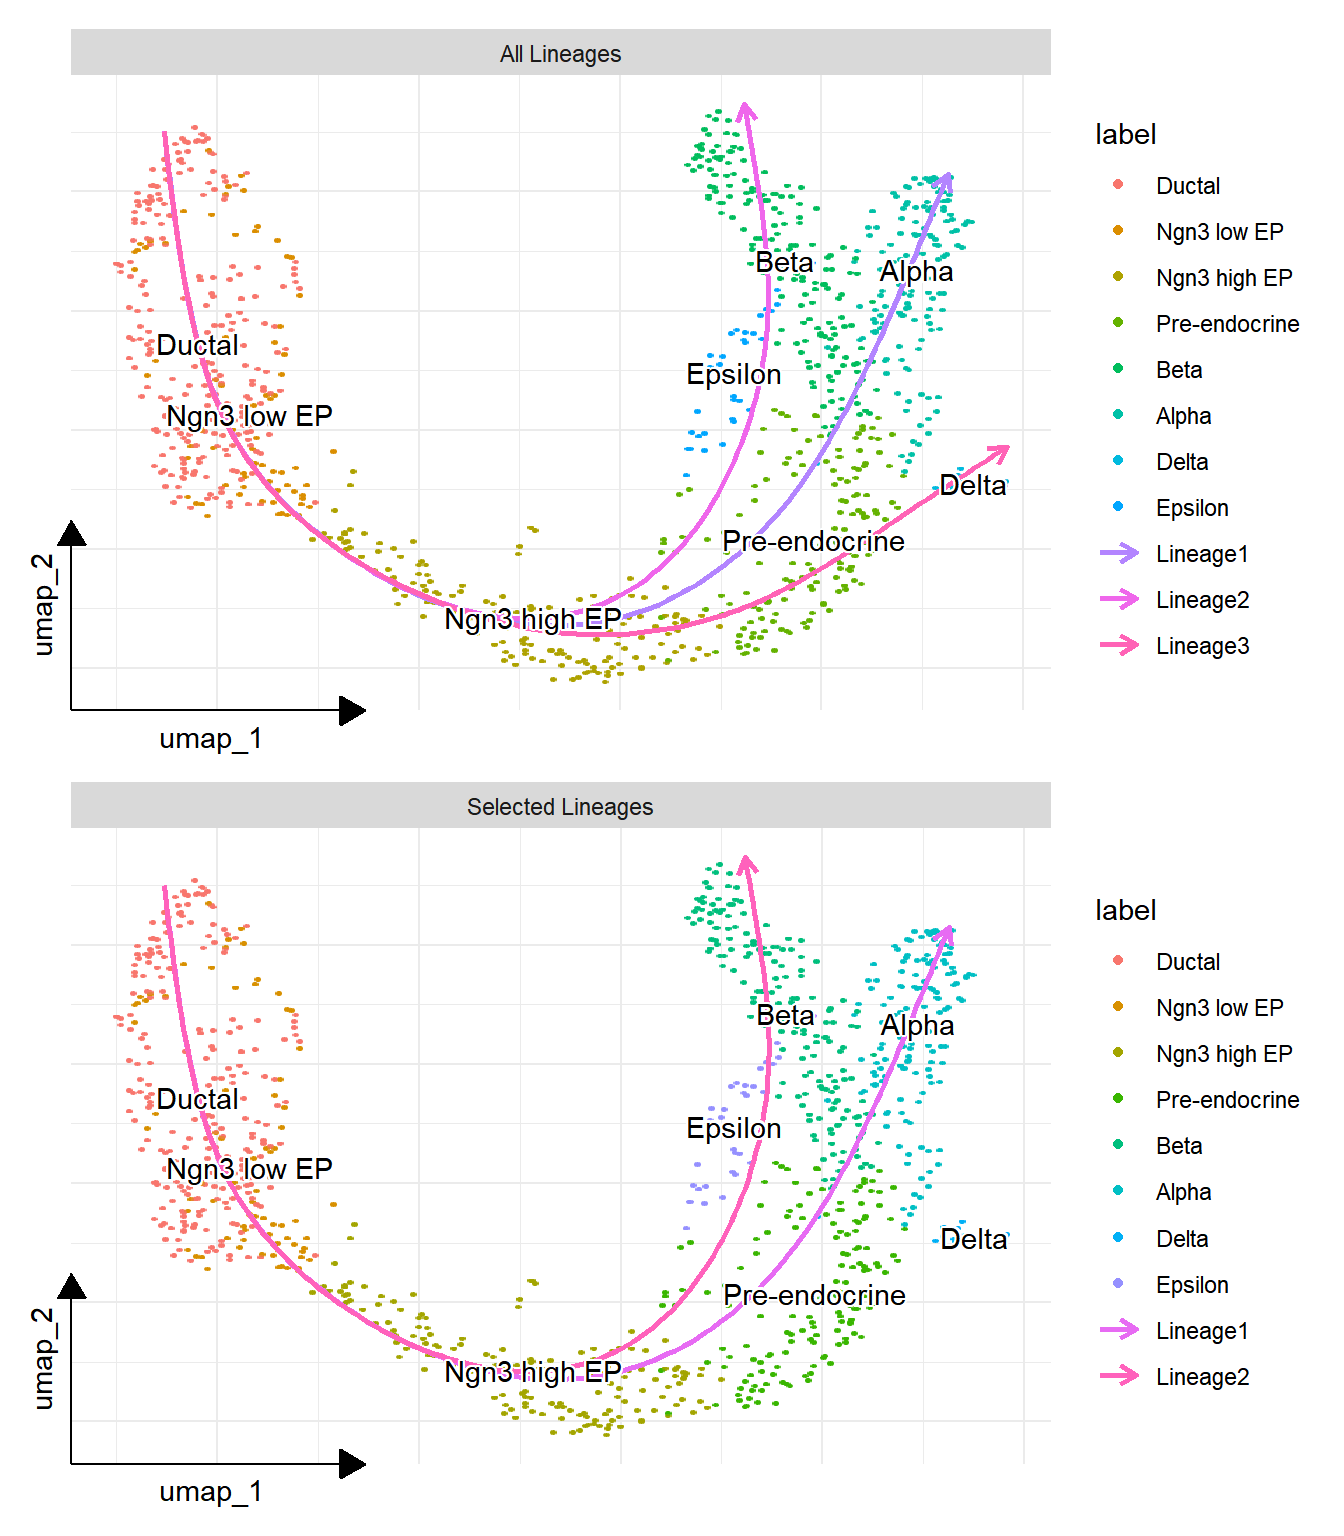
4.2 Pseudotime plot
pp1 <- pseudo_plot(panc, reduction = "UMAP", lineage = "Lineage1")
pp2 <- pseudo_plot(panc, reduction = "UMAP", lineage = "Lineage2")
pp_all <- pseudo_plot(panc, reduction = "UMAP")

plot_list(pp1, pp2, pp_all, design="AABB\nCCCC")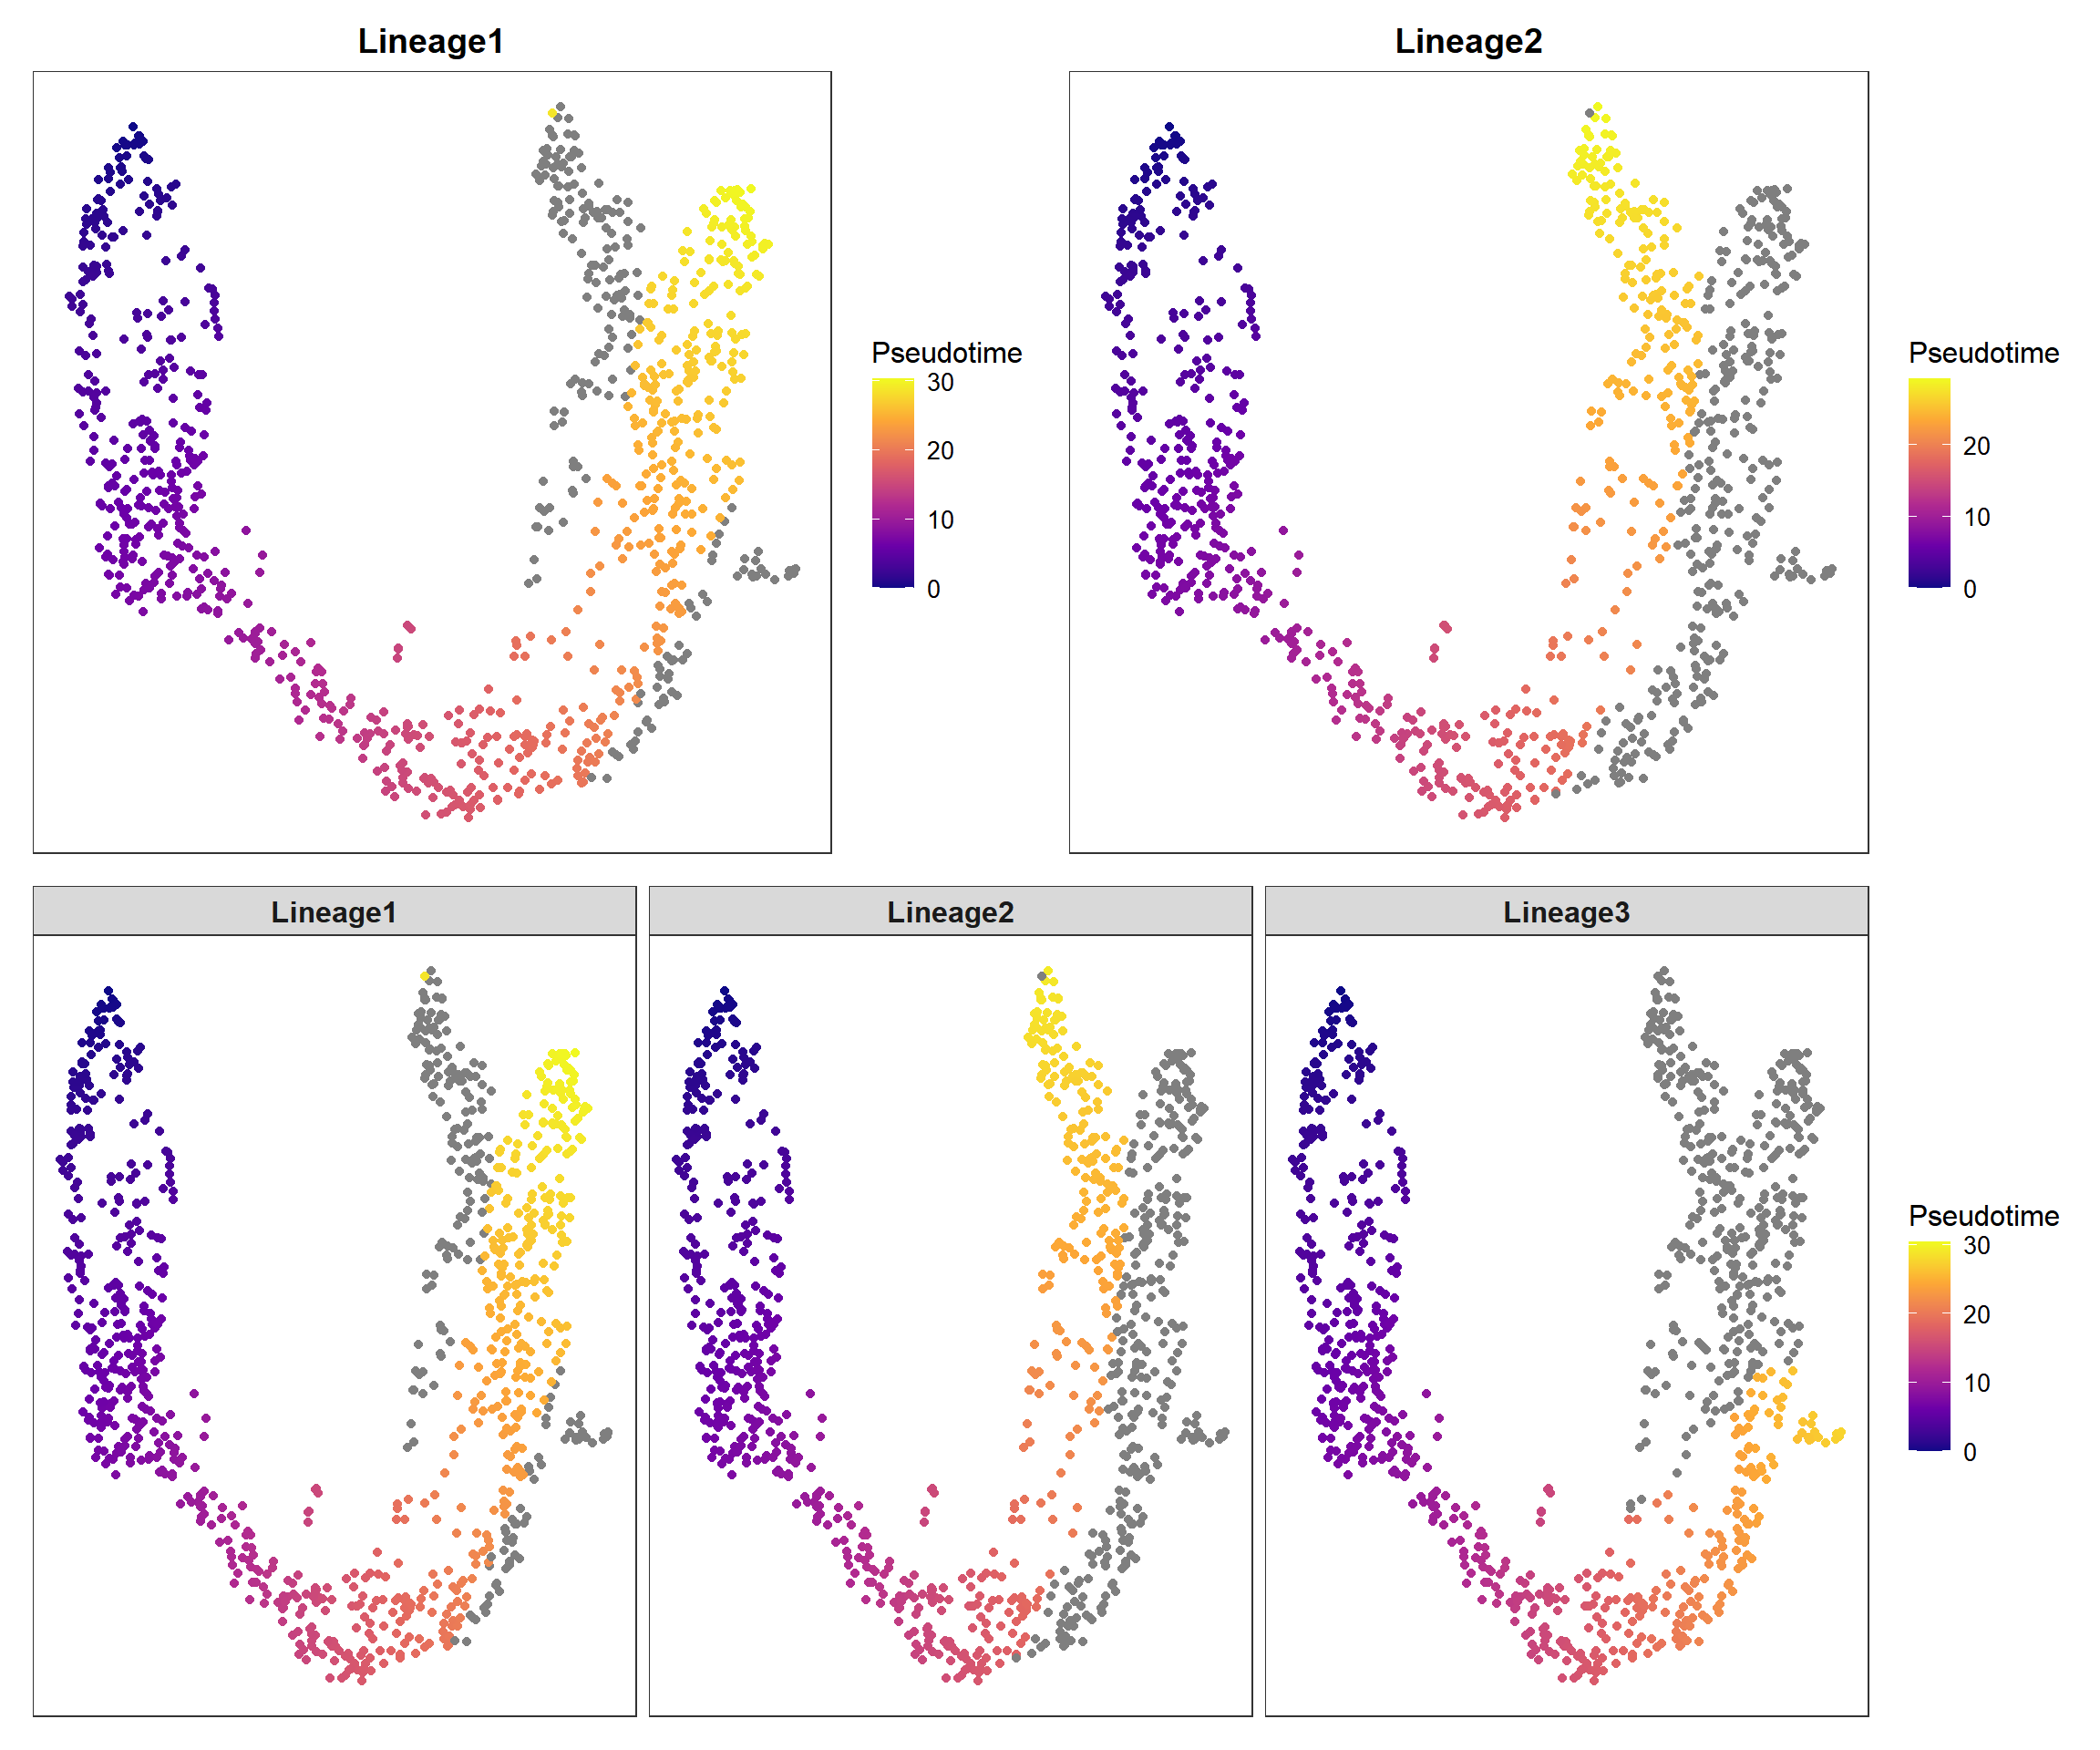
4.3 Expression trends in different cell trajectories
curve_genes <- c("Mrpl15", "Tram1", "Ncoa2")

## 默认选取smooth方法直接拟合得到的基因表达值结果来画图
p_curve <- genecurve_plot(panc, features = curve_genes, method = "smooth")

## 也可以用GAM计算预测的基因表达值来画图
p_curve1 <- genecurve_plot(panc, features = curve_genes, method = "gam")

plot_list(p_curve, p_curve1, ncol=1)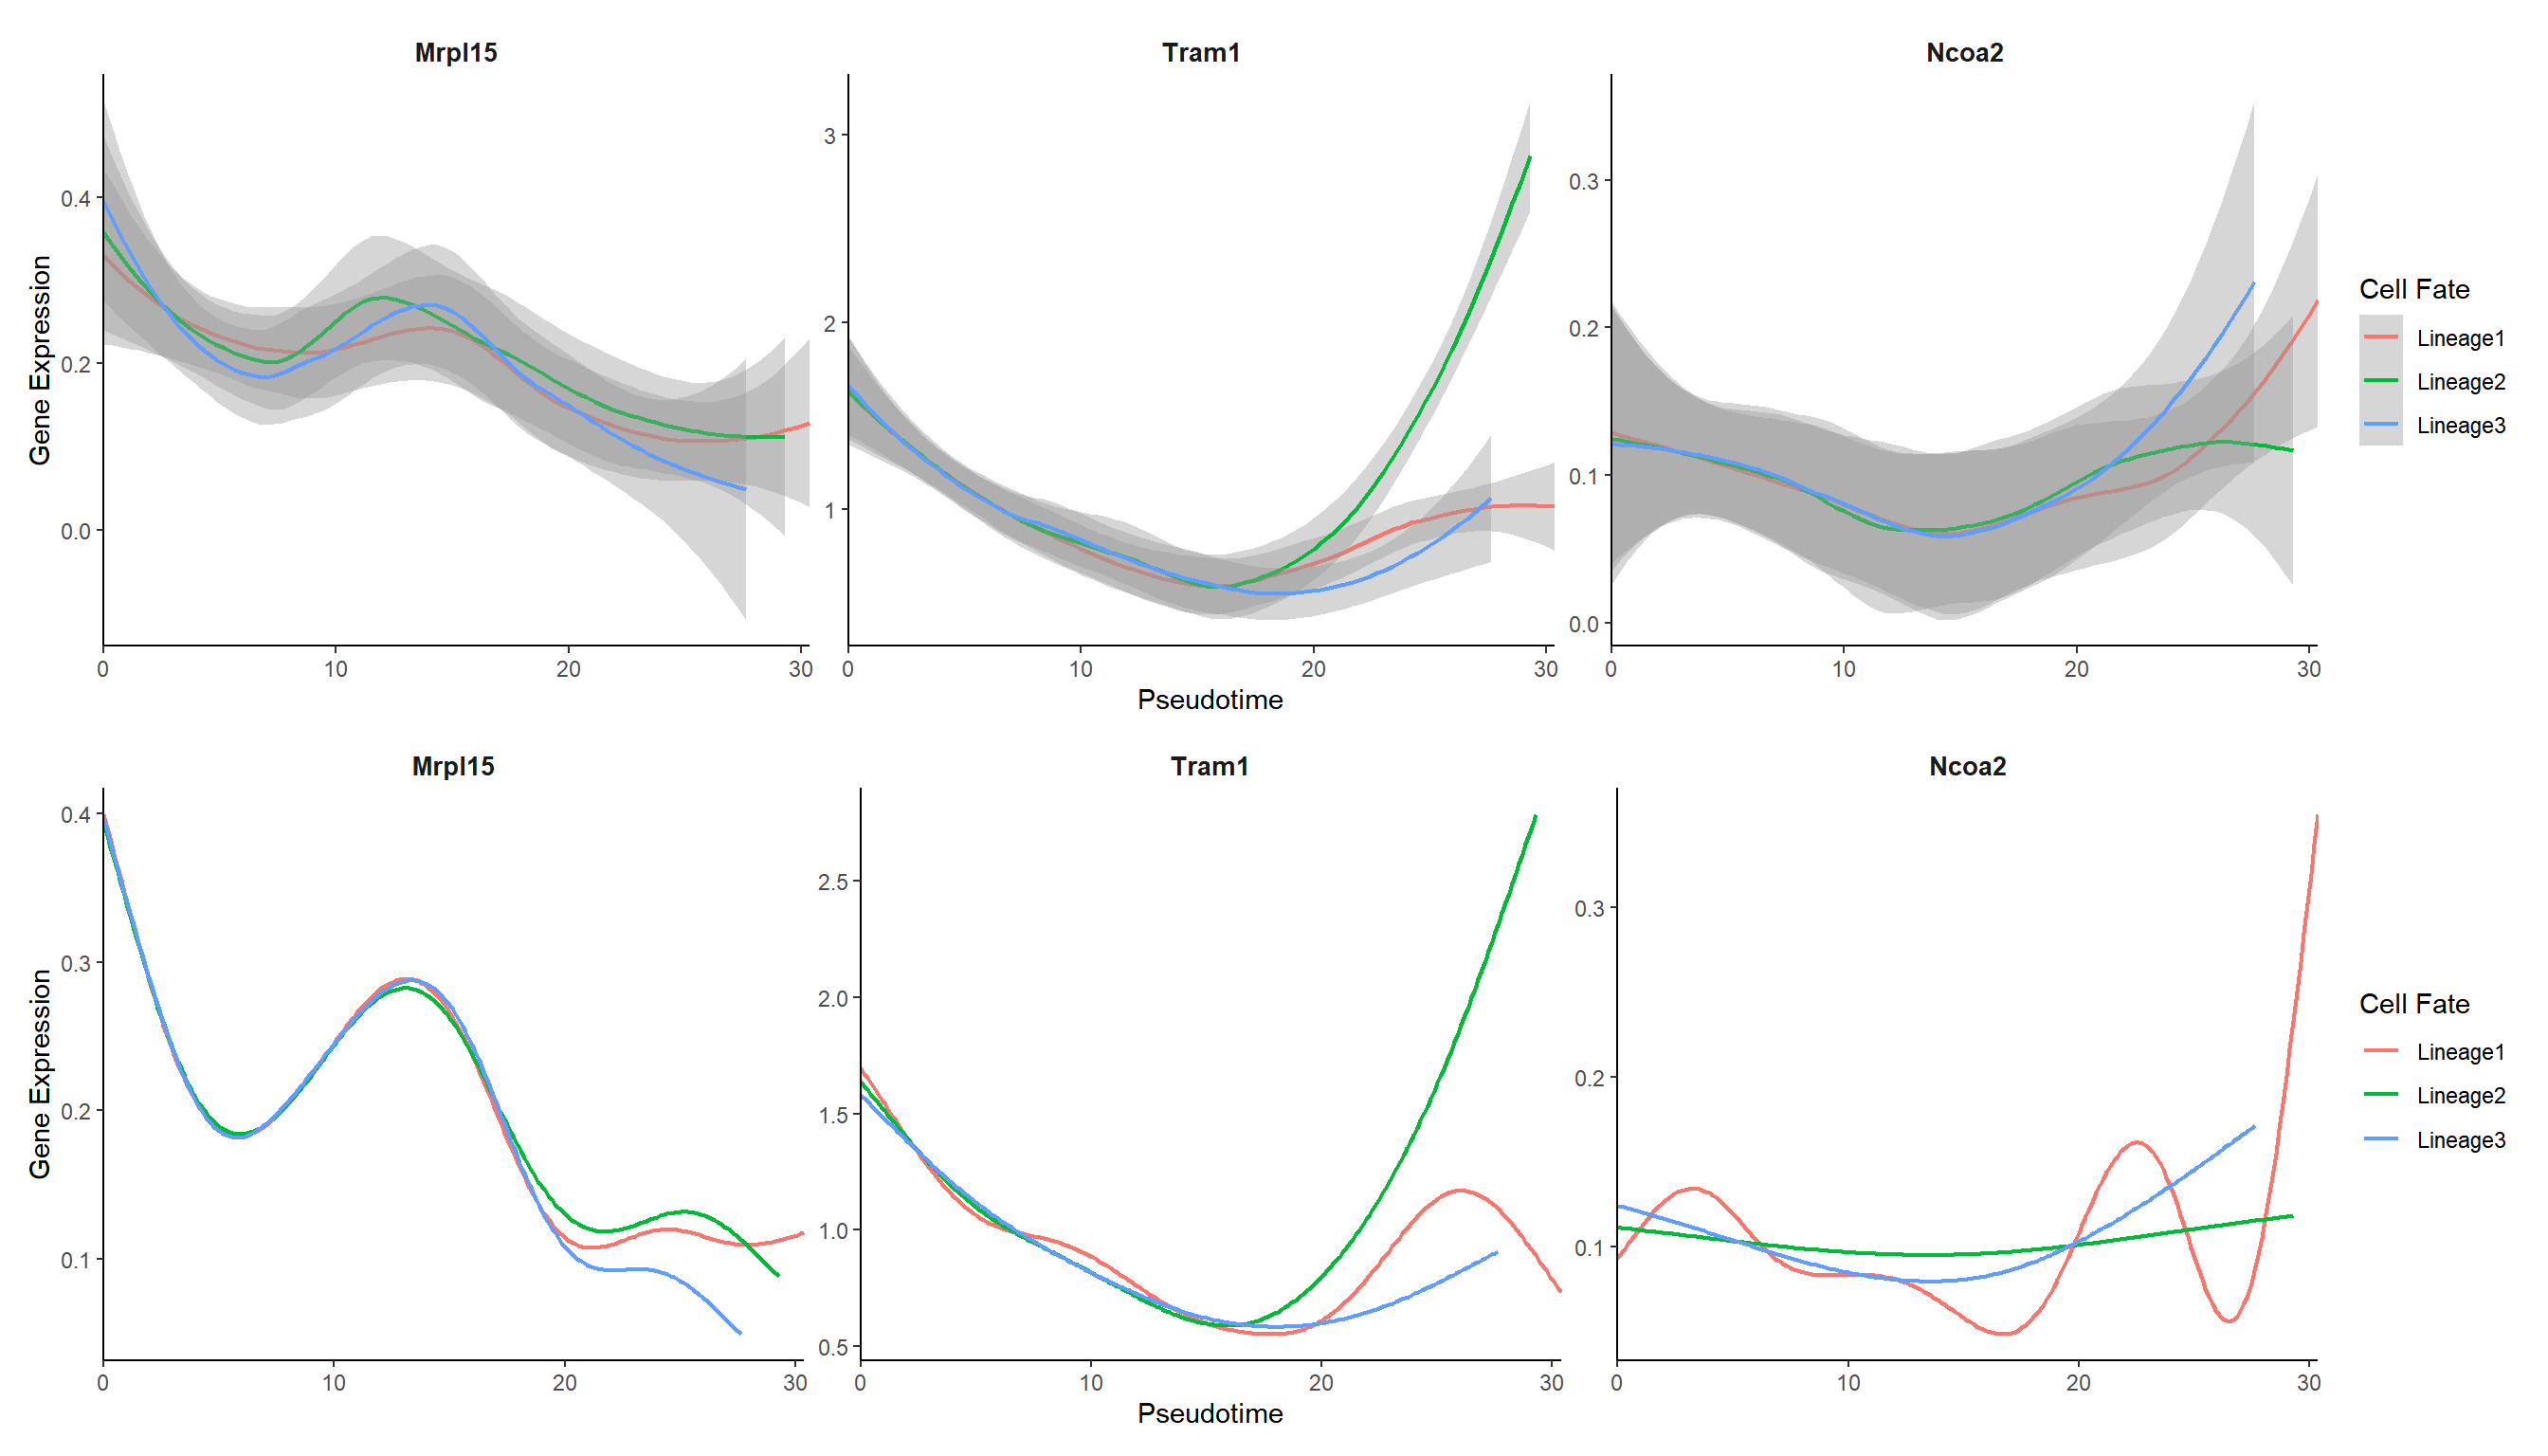
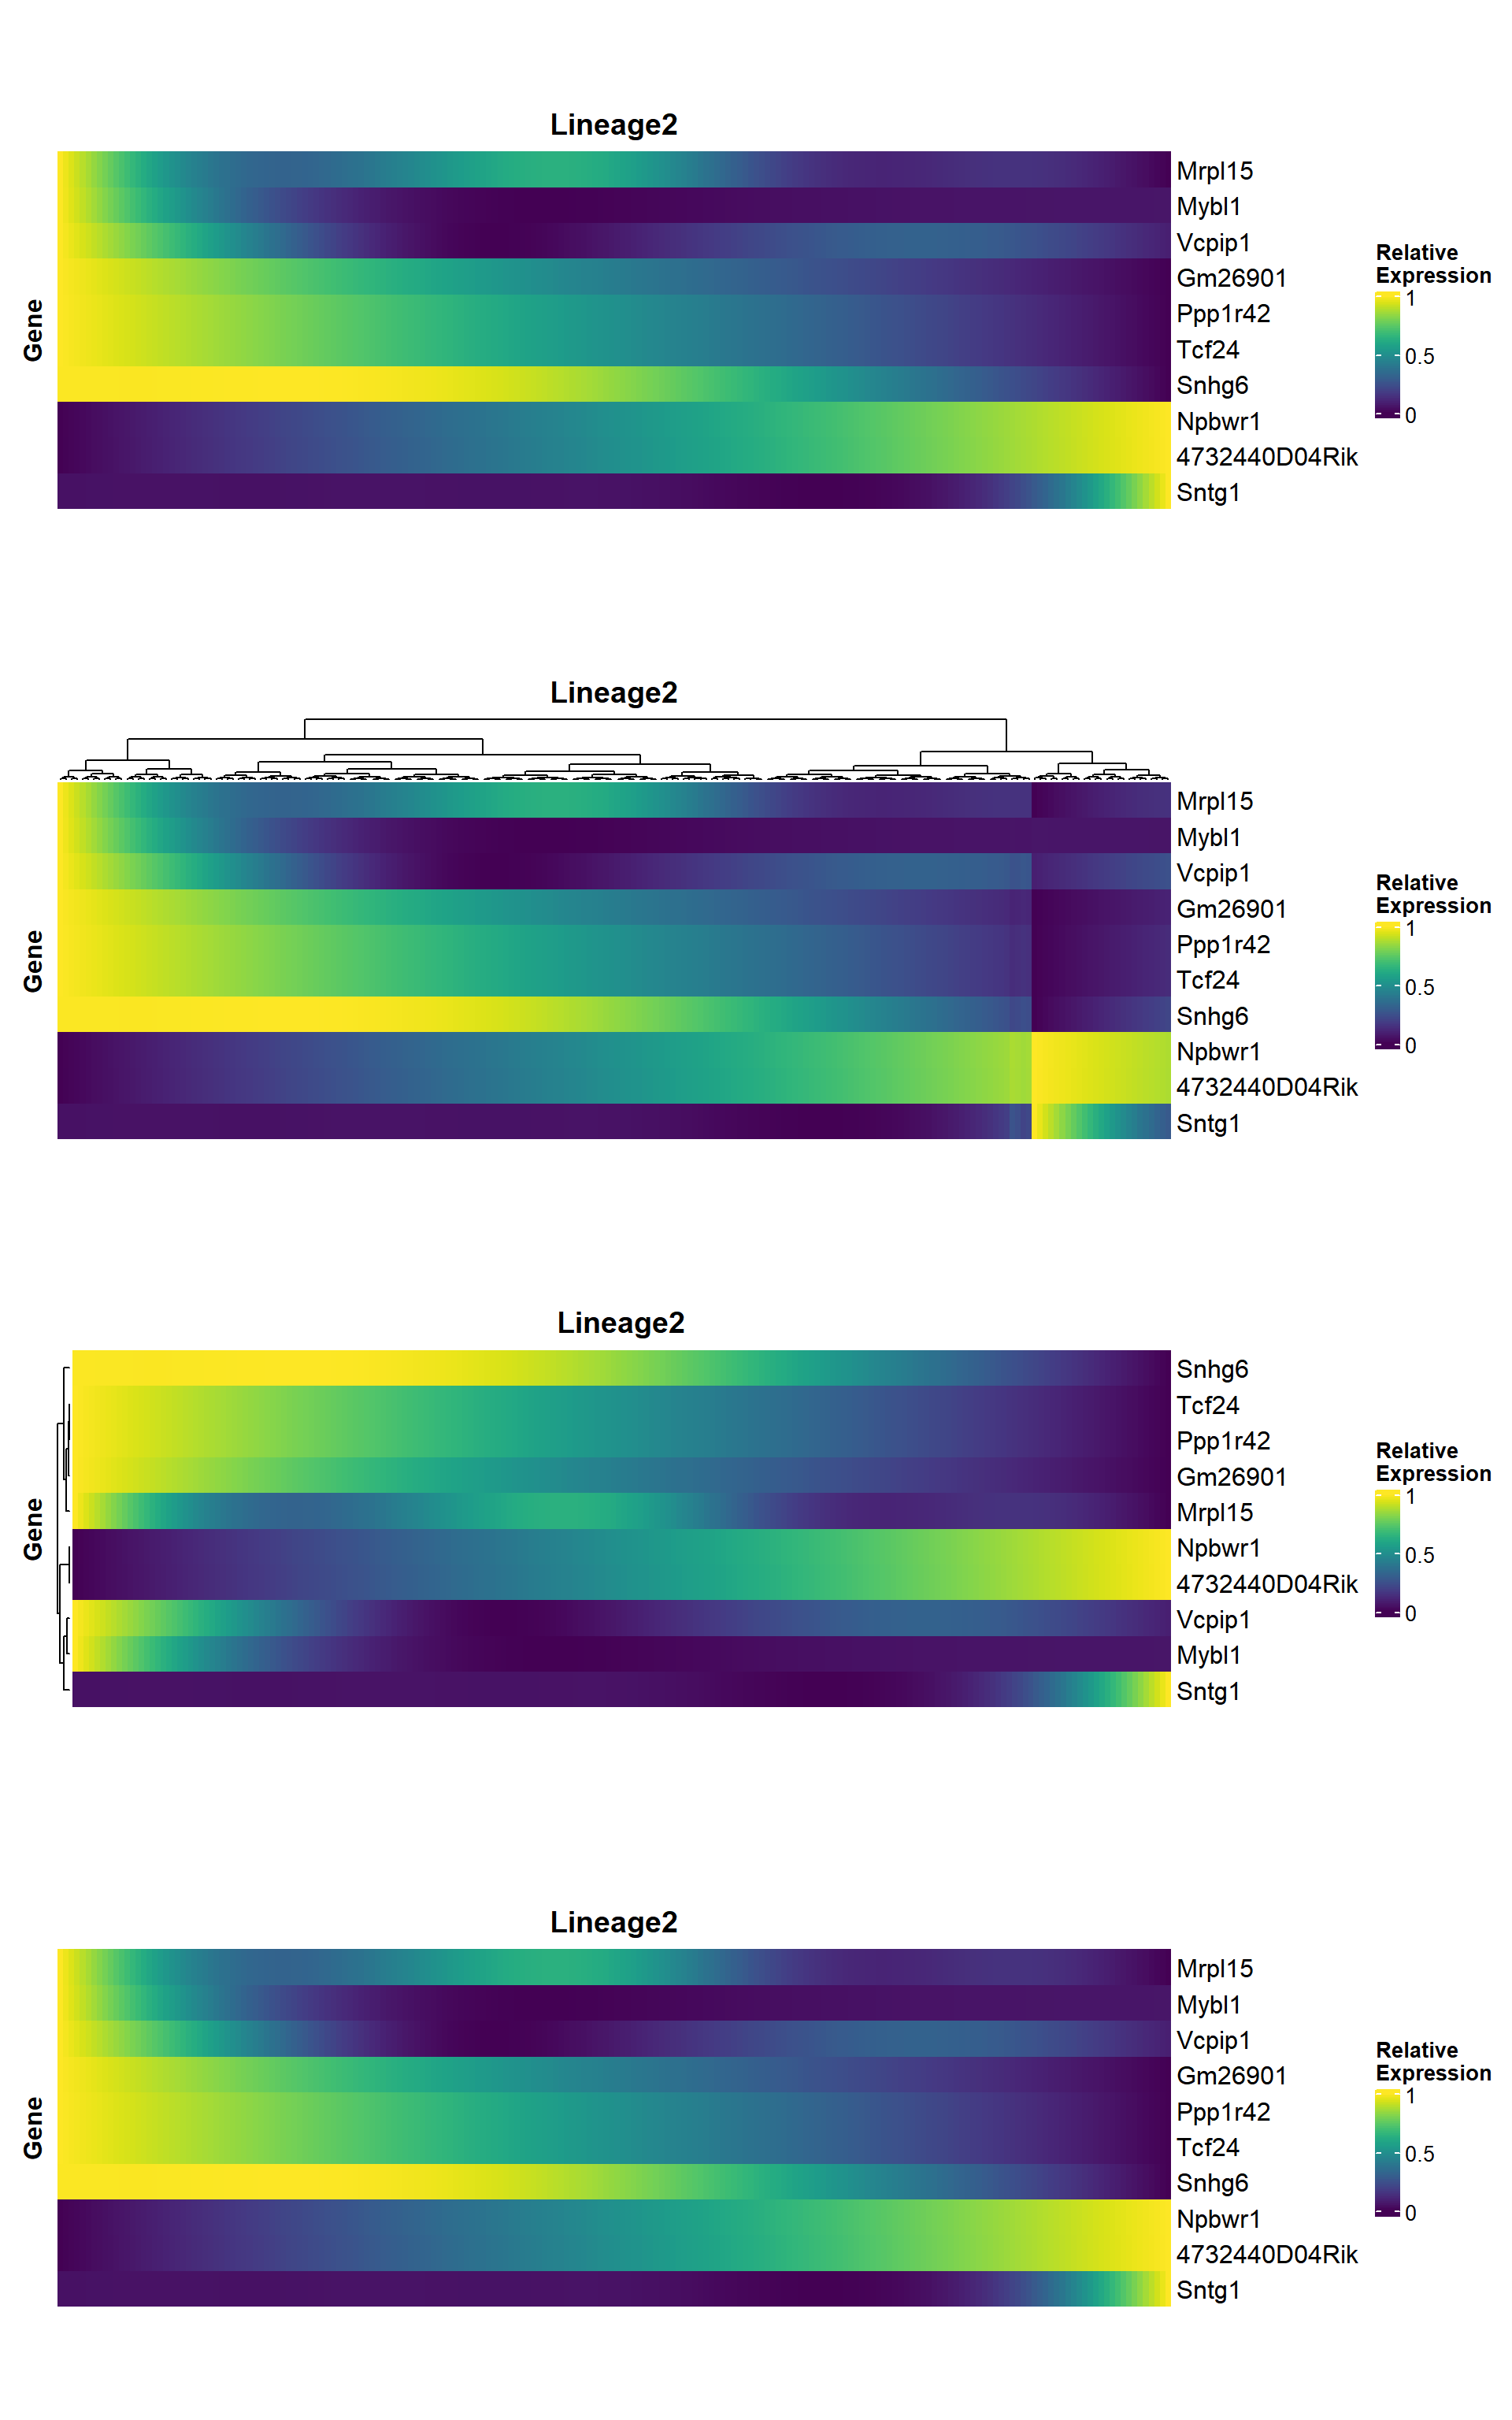
4.4 Heatmap
heatmap_genes <- head(unique(rownames(panc)), 10)

## 默认按照拟时间排序
hmp1 <- pseudo_heatmap(panc, features = heatmap_genes, lineage = "Lineage2")

## 可以手动对基因或细胞设置聚类(cluster = TRUE),此时会打乱pseudotime的排序
hmp2 <- pseudo_heatmap(panc, features = heatmap_genes, lineage = "Lineage2", cluster_columns = TRUE)

## 对基因聚类
hmp3 <- pseudo_heatmap(panc, features = heatmap_genes, lineage = "Lineage2", cluster_rows = TRUE, sort = FALSE)

## 默认排序
hmp4 <- pseudo_heatmap(panc, features = heatmap_genes, lineage = "Lineage2", cluster_rows = FALSE, sort = TRUE)

## 组合起来看就能看到两个参数的设定对行顺序的影响
aplot::plot_list(hmp1, hmp2, hmp3, hmp4, ncol=1)