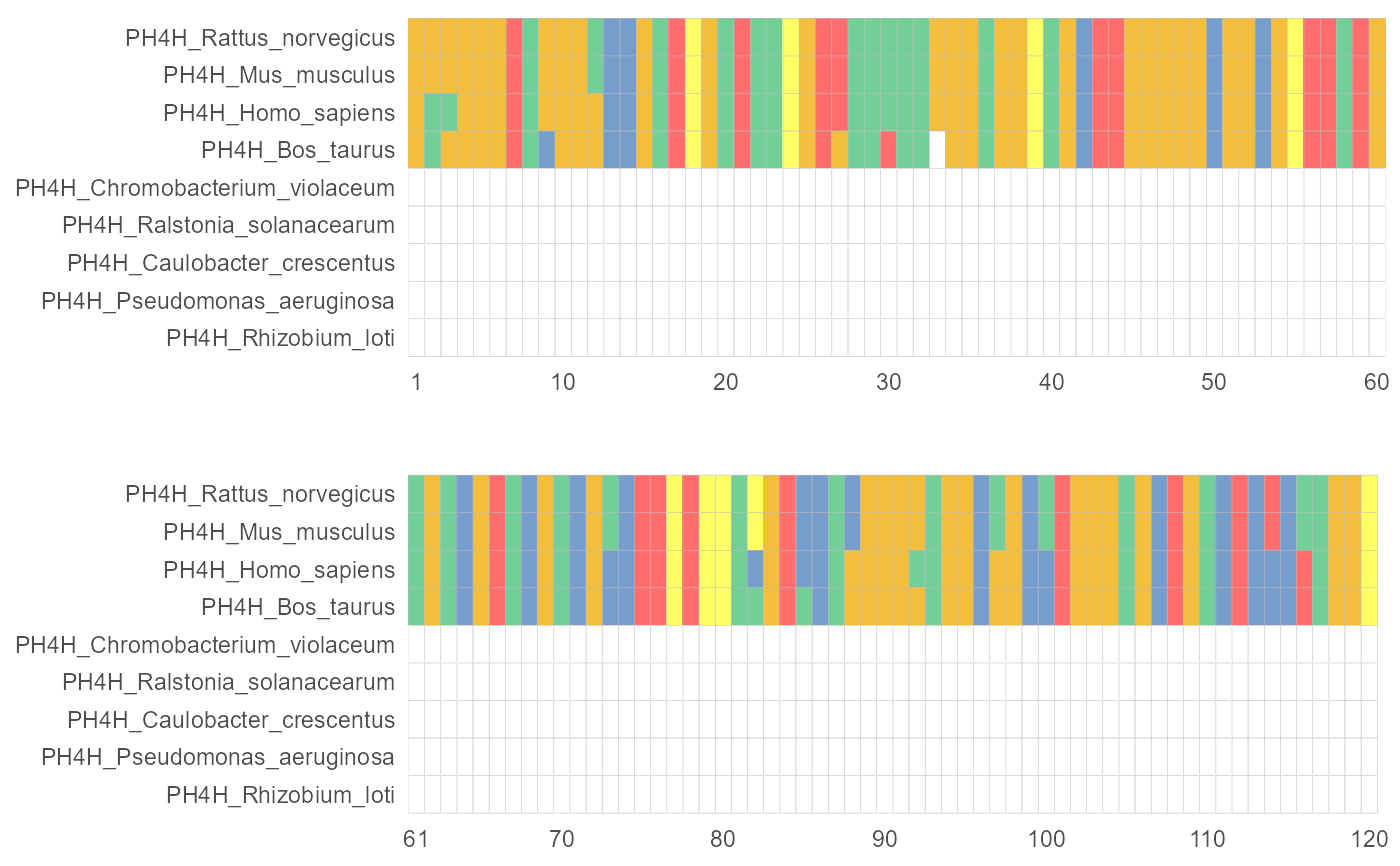
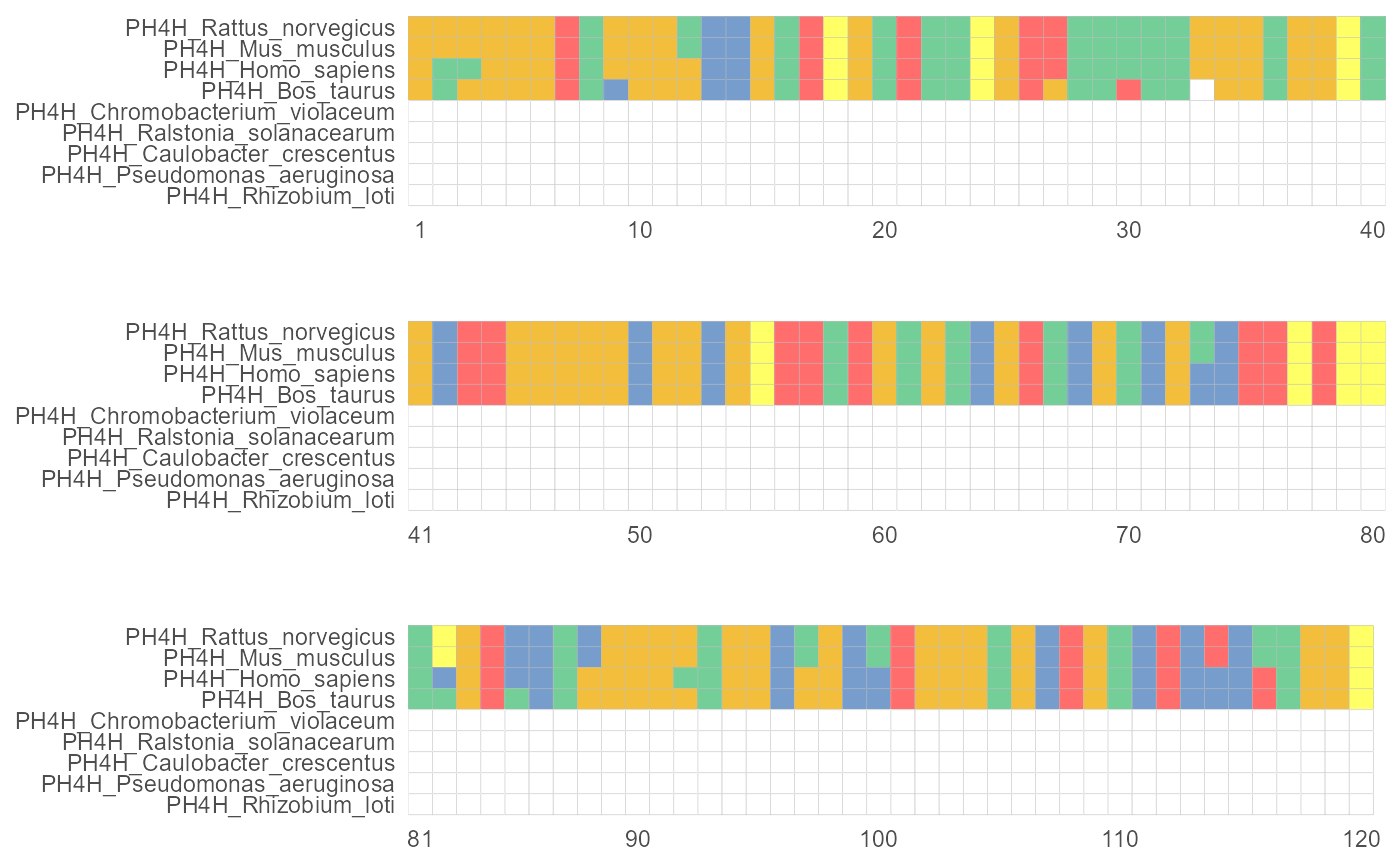
The MSA would be plot in a field that you set.

facet_msa(field)

Arguments

field

a numeric vector of the field size.

Value

ggplot layers

Author

Lang Zhou

Examples

library(ggplot2) f <- system.file("extdata/sample.fasta", package="ggmsa") # 2 fields ggmsa(f, end = 120, font = NULL, color="Chemistry_AA") + facet_msa(field = 60)
#> Scale for 'x' is already present. Adding another scale for 'x', which will #> replace the existing scale.
#> Coordinate system already present. Adding new coordinate system, which will replace the existing one.
# 3 fields ggmsa(f, end = 120, font = NULL, color="Chemistry_AA") + facet_msa(field = 40)
#> Scale for 'x' is already present. Adding another scale for 'x', which will #> replace the existing scale.
#> Coordinate system already present. Adding new coordinate system, which will replace the existing one.