Chapter 3 🚩 Biomarker Evaluation
3.1 Integrate analysis
The integrate_analysis() function returns the results of both the differential analysis and survival analysis for a gene or gene set within a dataset (or datasets).
integrate_analysis(SE=MEL_GSE91061, geneSet="CD274")## $`Response vs Non-Response`
## log2(FC) P Score
## 1 0.3162897 0.5257107 0.2792532
##
## $`Pre-Therapy vs Post-Therapy`
## log2(FC) P Score
## 1 -0.8121796 0.01780415 -1.749479
##
## $Survival
## HR P Score
## 0.9203840 0.8175588 -0.08748103.2 Differential analysis
You can use diff_biomk() to visualize differential analysis result between Pre-Treatment and Post-Treatment patients or Responders and Non-Responders in a specified gene or gene set.
Pre-Treatment vs Post-Treatment
diff_biomk(SE=MEL_GSE91061,gene='CD274',type='Treatment') +
  ggtitle("Pre-Treatment vs Post-Treatment") +
theme(plot.title = element_text(hjust = 0.5)) 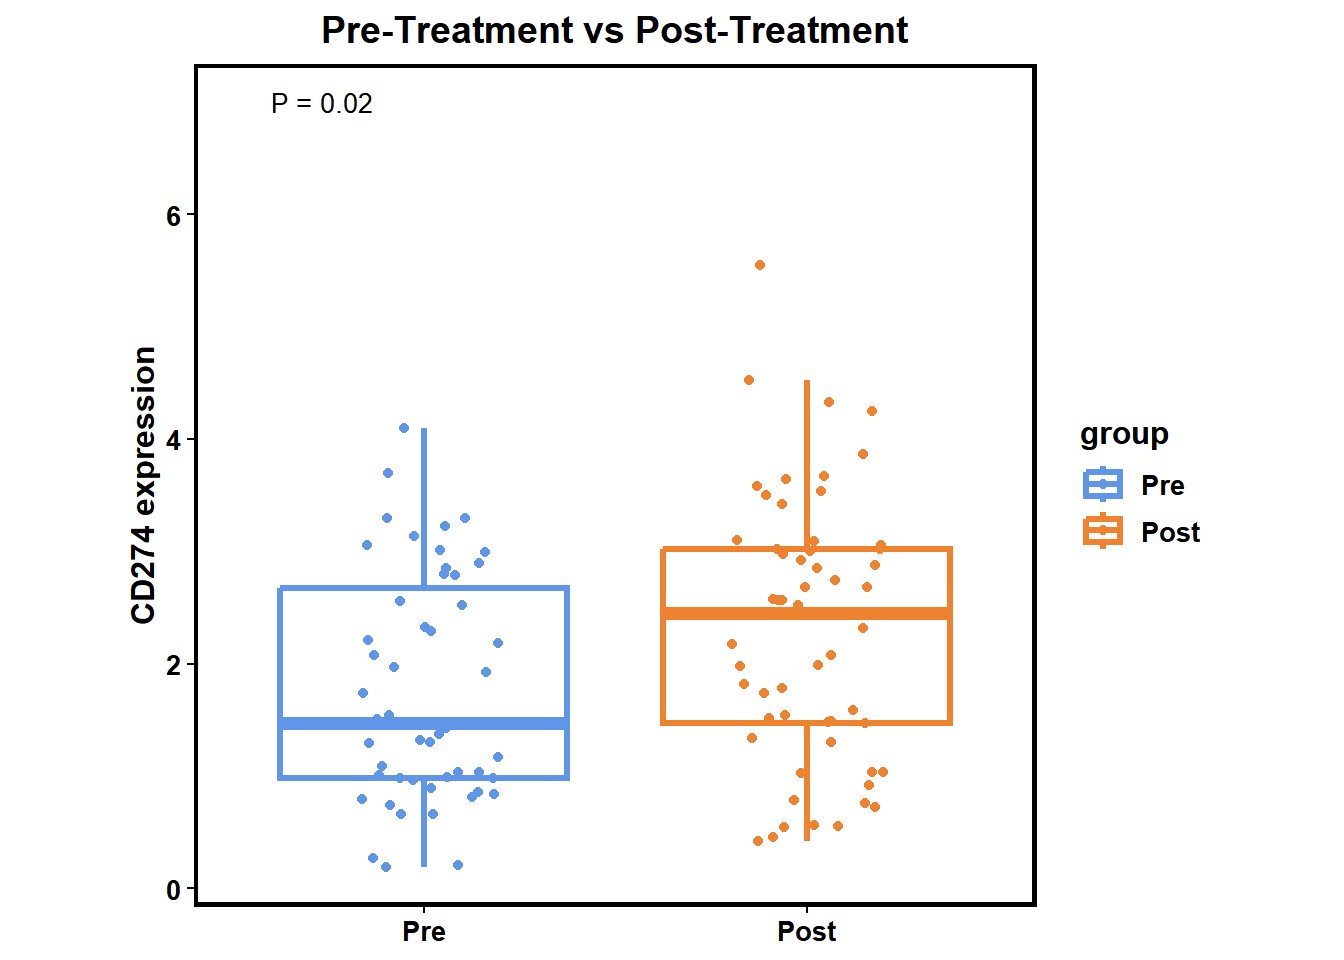
Responder vs Non-Responder
diff_biomk(SE=MEL_GSE91061,gene='CD274',type='Response') +
  ggtitle("Responder vs Non-Responder") +
  theme(plot.title = element_text(hjust = 0.5))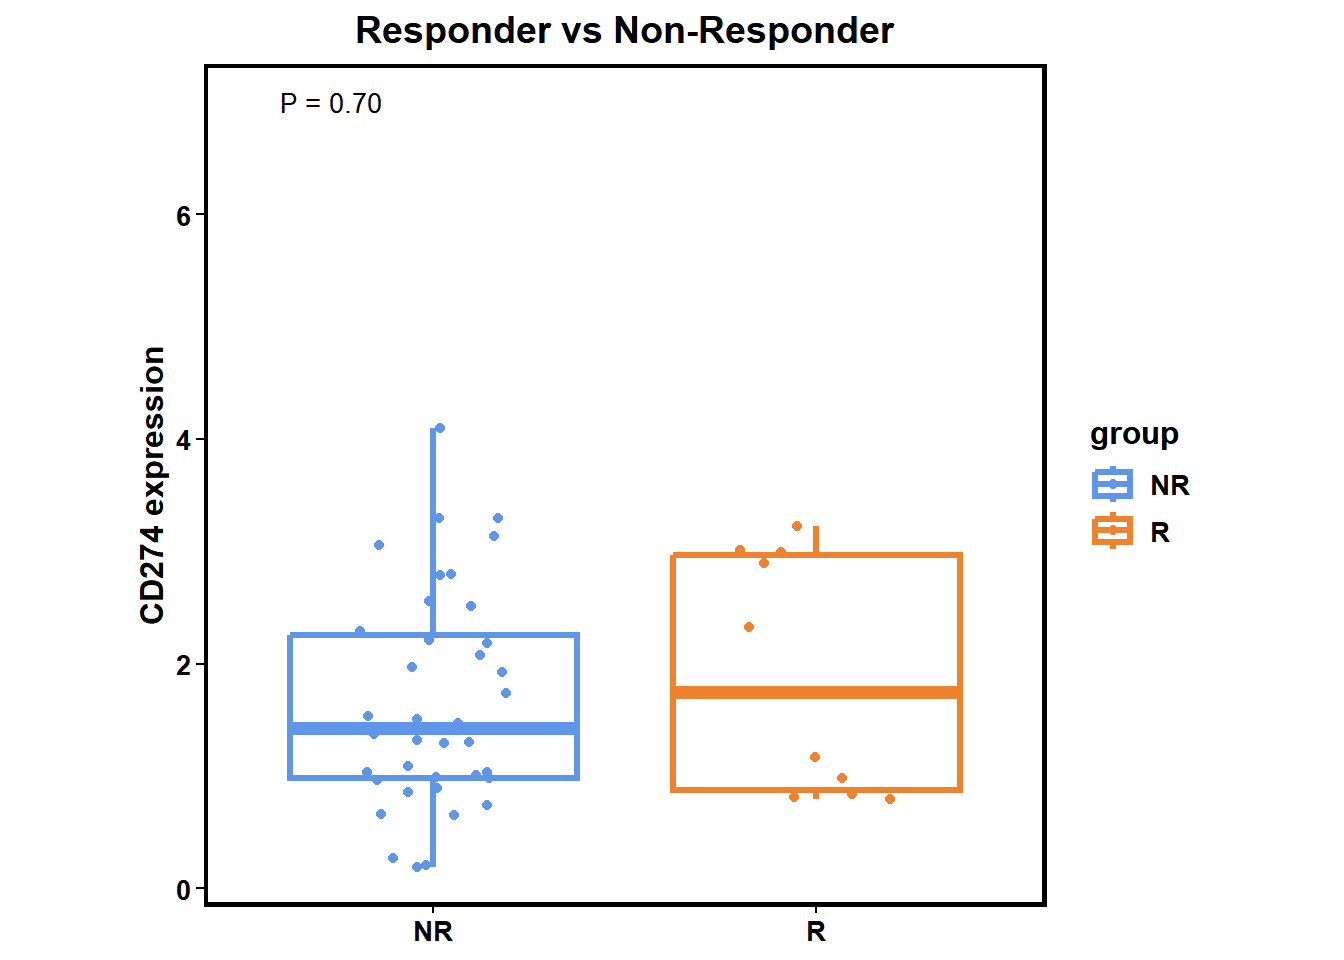
3.3 Suvival analysis
You can use diff_biomk() to visualize survival analysis result in specified gene.
P <- surv_biomk(SE=MEL_GSE91061,gene='CD274')
P$plot <- P$plot +
  ggtitle("Survival analysis") +
  theme(plot.title = element_text(hjust = 0.5))
P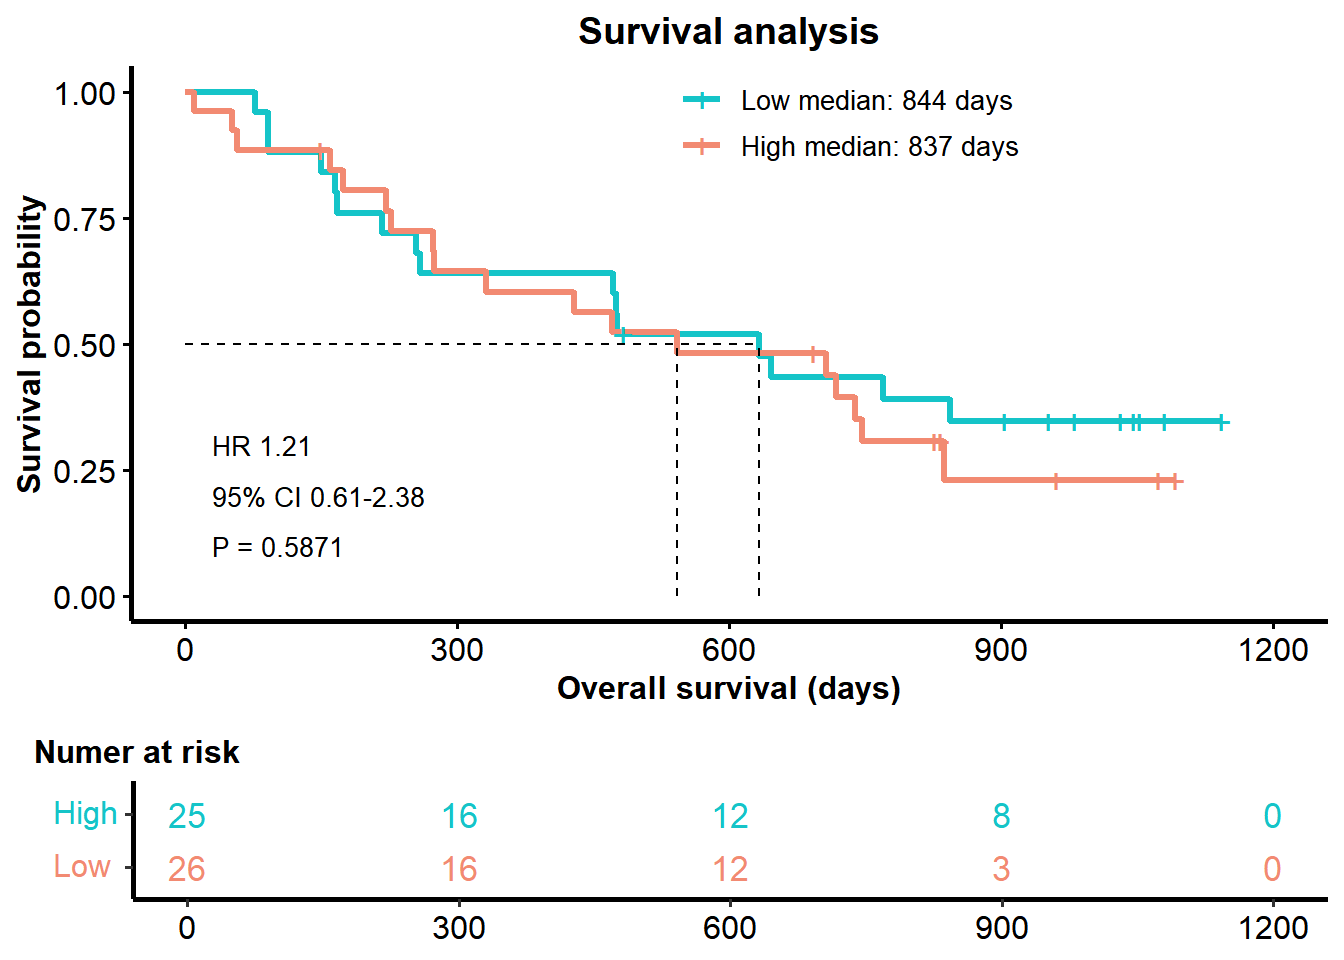
3.4 Calculate comprehensive signature score
By employing the score_biomk() function, you can obtain a comprehensive signature score matrix for the 23 signatures in tigeR. In this matrix, the columns represent the signature scores, and the rows denote the sample names.
| Signature | Full Name | Method | PMID | Cancer Type |
|---|---|---|---|---|
| IRS | Immunosenescence-related gene signature | Multivariate cox analysis | 35280438 | Urothelial Cancer |
| tGE8 | Eight-gene cytotoxic T cell transcriptional signature | Median of Z-score | 31686036 | Muscle-invasive Urothelial Cancer |
| MEMTS | Metastasis related epithelial-mesenchymal transition signature | Average mean | 35769483 | Gastric Cancer |
| PRGScore | Pyroptosis-related gene score | Average mean | 35479097 | Urothelial Cancer; Melanoma |
| Angiogenesis | Angiogenesis | Average mean | 29867230 | Metastatic Renal Cell Carcinoma |
| Teffector | T-effector response | Average mean | 29867230 | Metastatic Renal Cell Carcinoma |
| Myeloid_inflammatory | Myeloid inflammatory gene expression signatures | Average mean | 29867230 | Metastatic Renal Cell Carcinoma |
| IFNG_Sig | IFNG-response gene expression signature | Average mean | 29150430 | Melanoma |
| TLS | Gene signature associated with tertiary lymphoid structures | Weighted mean | 31942071 | Melanoma |
| MSKCC | Signature constructed based on the Memorial Sloan Kettering Cancer Center ICI cohort | Weighted mean | 34421886 | Bladder Cancer |
| LMRGPI | Lipid metabolism-related gene prognostic index | Weighted mean | 35582412 | Urothelial Cancer |
| PRS | Pyroptosis-related risk score | Weighted mean | 35085103 | Breast Carcinoma |
| Stemness_signature | Stemness-relevant prognostic gene signature | Weighted mean | 35681225 | Colorectal Cancer;Urothelial Cancer;Melanoma |
| GRIP | Genes related to both inflammation and pyroptosis | Weighted mean | 35492358 | Melanoma |
| IPS | Immune prognostic signature | Weighted mean | 32572951 | Glioblastoma |
| Tcell_inflamed_GEP | T cell-inflamed gene expression profile | Weighted mean | 30309915 | Pan-tumor |
| DDR | DNA damage response | Z-score; PCA | 29443960 | Urothelial Cancer |
| CD8Teffector | CD8 T effector | Z-score; PCA | 29443960 | Non-small Cell Lung Carcinoma |
| CellCycleReg | Cell cycle regulator gene set | Z-score; PCA | 29443960 | Urothelial Cancer |
| PanFTBRs | Pan tissue fibroblast TGF-β response signature | Z-score; PCA | 29443960 | Urothelial Cancer |
| EMT1 | Epithelial-to-mesenchymal transition signature 1 | Z-score; PCA | 29443960 | Urothelial Cancer |
| EMT2 | Epithelial-to-mesenchymal transition signature 2 | Z-score; PCA | 29443960 | Urothelial Cancer |
| EMT3 | Epithelial-to-mesenchymal transition signature 3 | Z-score; PCA | 29443960 | Urothelial Cancer |
sig_res <- score_biomk(MEL_GSE78220)Columns represent signatures and rows represent sample.
3.5 Assess the performance of signature
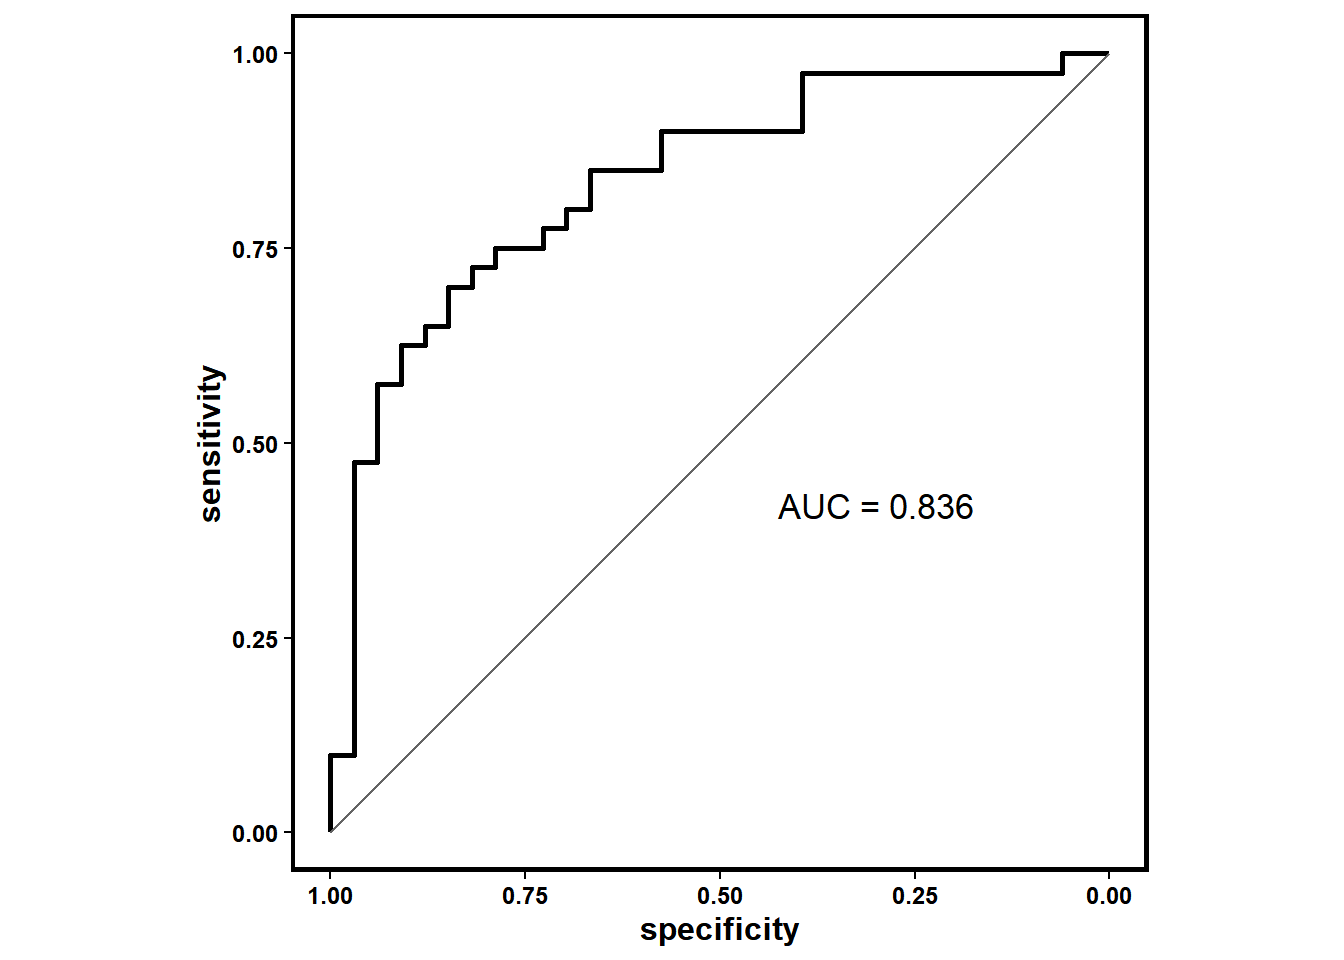
By employing the roc_biomk() function, you can assess the performance of built-in and custom signatures in different datasets. The function will generate a roc object and a curve to assess the predictive performance.
sig_roc <-
roc_biomk(MEL_PRJEB23709,
          Weighted_mean_Sigs$Tcell_inflamed_GEP,
          method = "Weighted_mean",
          rmBE=TRUE,
response_NR=TRUE)sig_roc[[1]]##
## Call:
## roc.default(response = data[[2]]$response, predictor = value)
##
## Data: value in 33 controls (data[[2]]$response N) < 40 cases (data[[2]]$response R).
## Area under the curve: 0.836433 observed non-responders and 40 observed responders are included in this analysis
sig_roc[[2]]