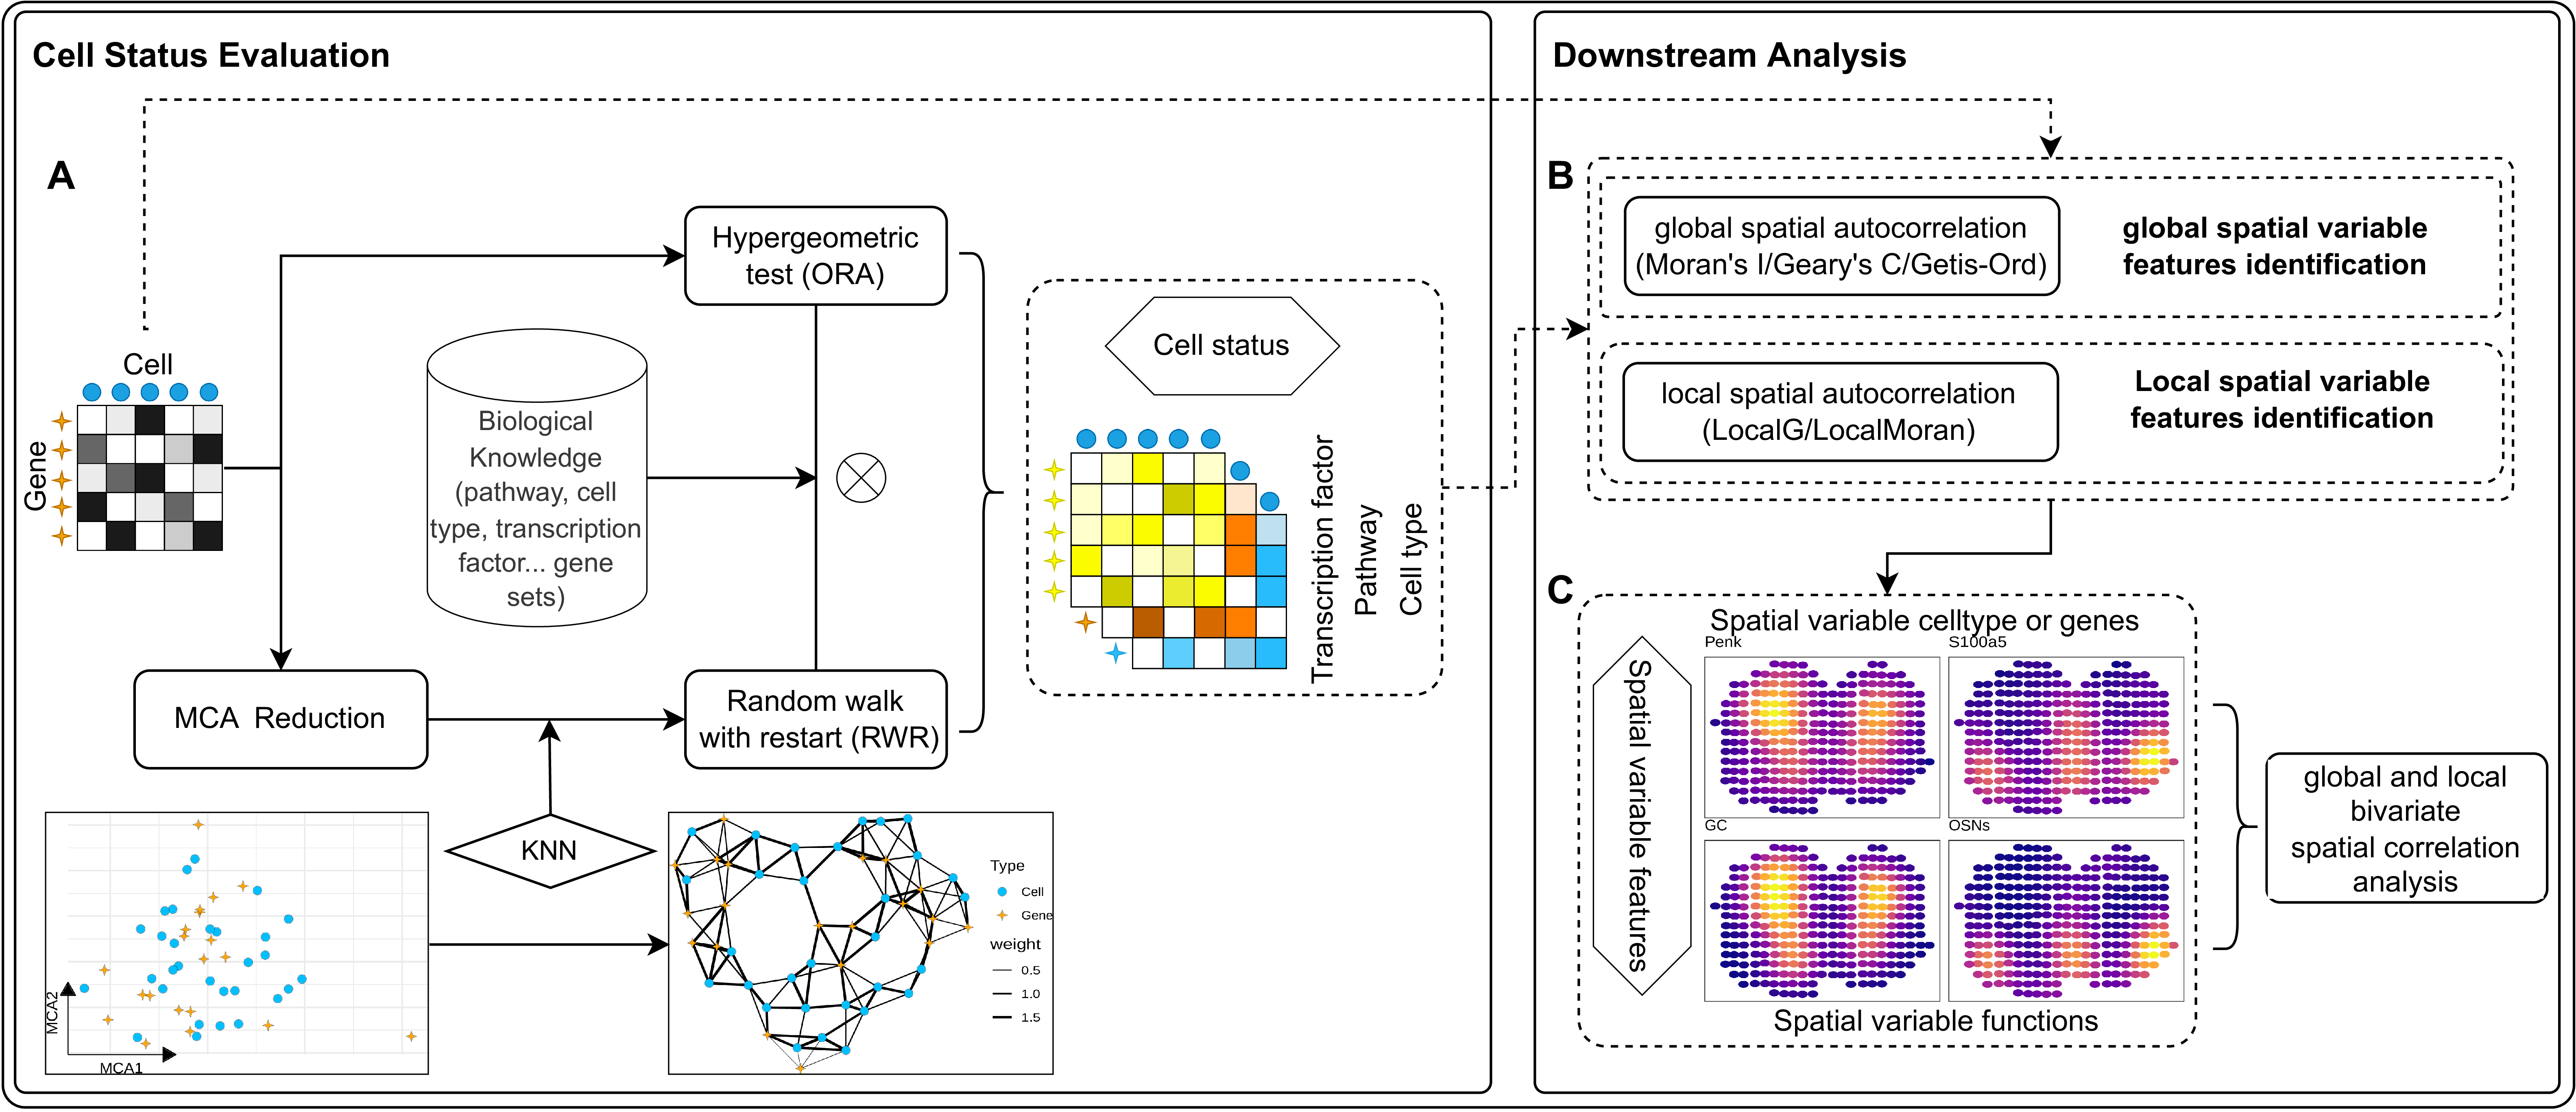
1 Overview of SVP
The evaluation of functional status at individual locations captured by SVP is achieved using Multiple Correspondence Analysis (MCA) for dimensionality reduction. This process employs a standardized gene expression matrix to project both cells and genes into a unified MCA space. It has been established that this method allows for the calculation of distances not only between genes and cells but also between cells and genes, thereby facilitating the assessment of their associations(Cortal et al. 2021). Proximity in this space indicates a stronger relationship. These calculated distances are crucial for constructing a weighted k-nearest neighbors (KNN) network, linking each cell or gene to its most relevant counterparts. To discern features with varying levels of proximity, distances are first normalized to a 0-1 scale, with closer distances approaching 1 and farther distances approaching 0. This normalization is followed by division by the total distance among the nearest features, thereby assigning greater connection weights to closer features. Subsequently, databases of known biological knowledge, such as transcription factor target gene sets, Reactome functional gene sets, and cell-type marker gene sets, serve as initial seeds. Random walks on the constructed weighted KNN network yield preliminary functional state activity scores for each location. To mitigate potential biases introduced by dimensionality reduction, a hypergeometric distribution test enhances the enrichment analysis of top-ranking genes extracted directly from the expression matrix at each location. These analyses provide weights for functional activities, culminating in the derivation of functional activity scores at the single captured location (Fig. 1A).
To identify spatially variable cell functions, we first established a cell neighbor weight matrix based on spot locations using the Delaunay triangulation (default) or KNN algorithm. This weight matrix, alongside global autocorrelation analyses such as Moran’s I (default), Geary’s C, or Getis-Ord’s G, facilitated the identification of spatially variable cell functions or gene characteristics. Additionally, we utilized the same cell neighbor weight matrix and local spatial autocorrelation algorithms (Local Getis-Ord or Local Moran) to delineate the local spatial distribution of these variable features (Fig. 1B). To examine spatial co-distribution among cell functions, we designed a bivariate spatial global and local autocorrelation algorithm employing the Lee index. This approach enables the assessment of correlation between different cell characteristics in their spatial distribution (Fig. 1C).

Figure 1.1: Overview of SVP