plot method for SeqDiff object
plot-methods.Rdplot method for SeqDiff object
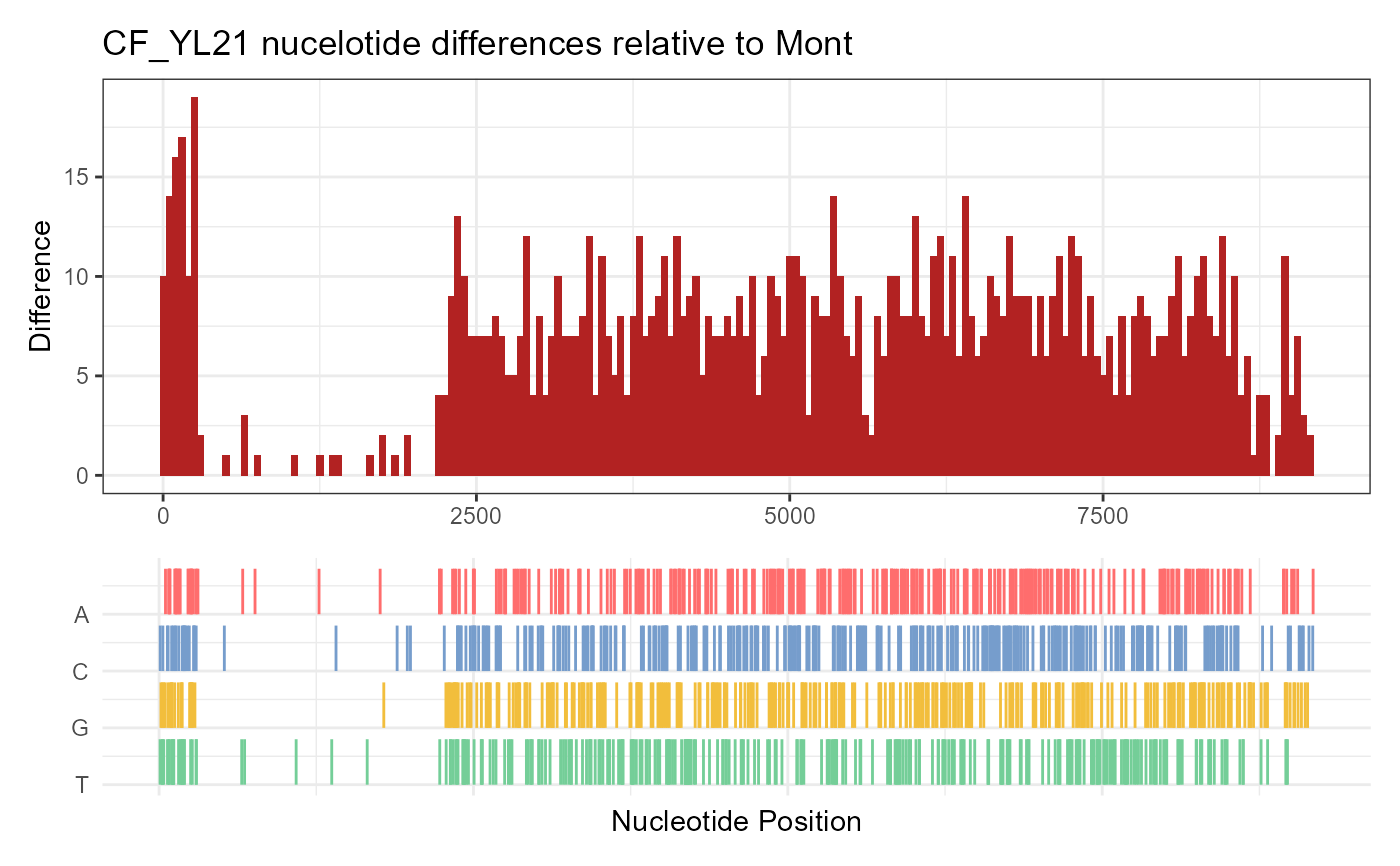
# S4 method for SeqDiff,ANY
plot(
  x,
  width = 50,
  title = "auto",
  xlab = "Nucleotide Position",
  by = "bar",
  fill = "firebrick",
  colors = c(A = "#ff6d6d", C = "#769dcc", G = "#f2be3c", T = "#74ce98"),
  xlim = NULL
)
Arguments
| x | SeqDiff object |
|---|---|
| width | bin width |
| title | plot title |
| xlab | xlab |
| by | one of 'bar' and 'area' |
| fill | fill color of upper part of the plot |
| colors | color of lower part of the plot |
| xlim | limits of x-axis |
Value
plot
Author
guangchuang yu
Examples
fas <- list.files(system.file("extdata", "GVariation", package="ggmsa"),
                  pattern="fas", full.names=TRUE)
x1 <- seqdiff(fas[1], reference=1)
plot(x1)