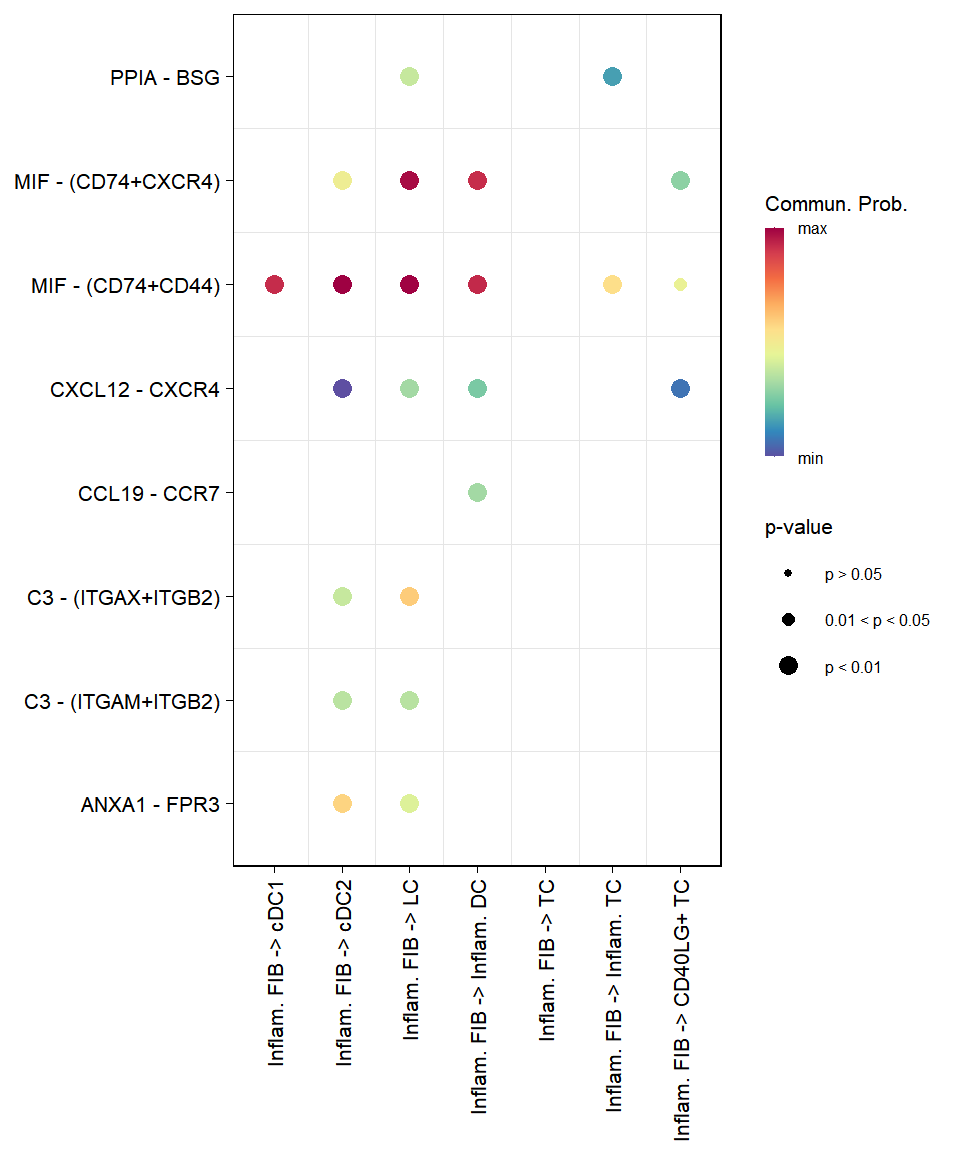
14 Enhanced Visualization chapter.
Instead of relying heavily on third-party specific visualization functions, sclet provides native ggplot2 and circlize based visualization functions that directly consume the standardized CCI data layer. This decouples your analysis from specific backend plotting idiosyncrasies.
# Native Bubble plot for specific cell pairs
plot_cci_bubble(sce, sources = c("Ductal", "Endocrine"), targets = c("Ductal", "Endocrine"))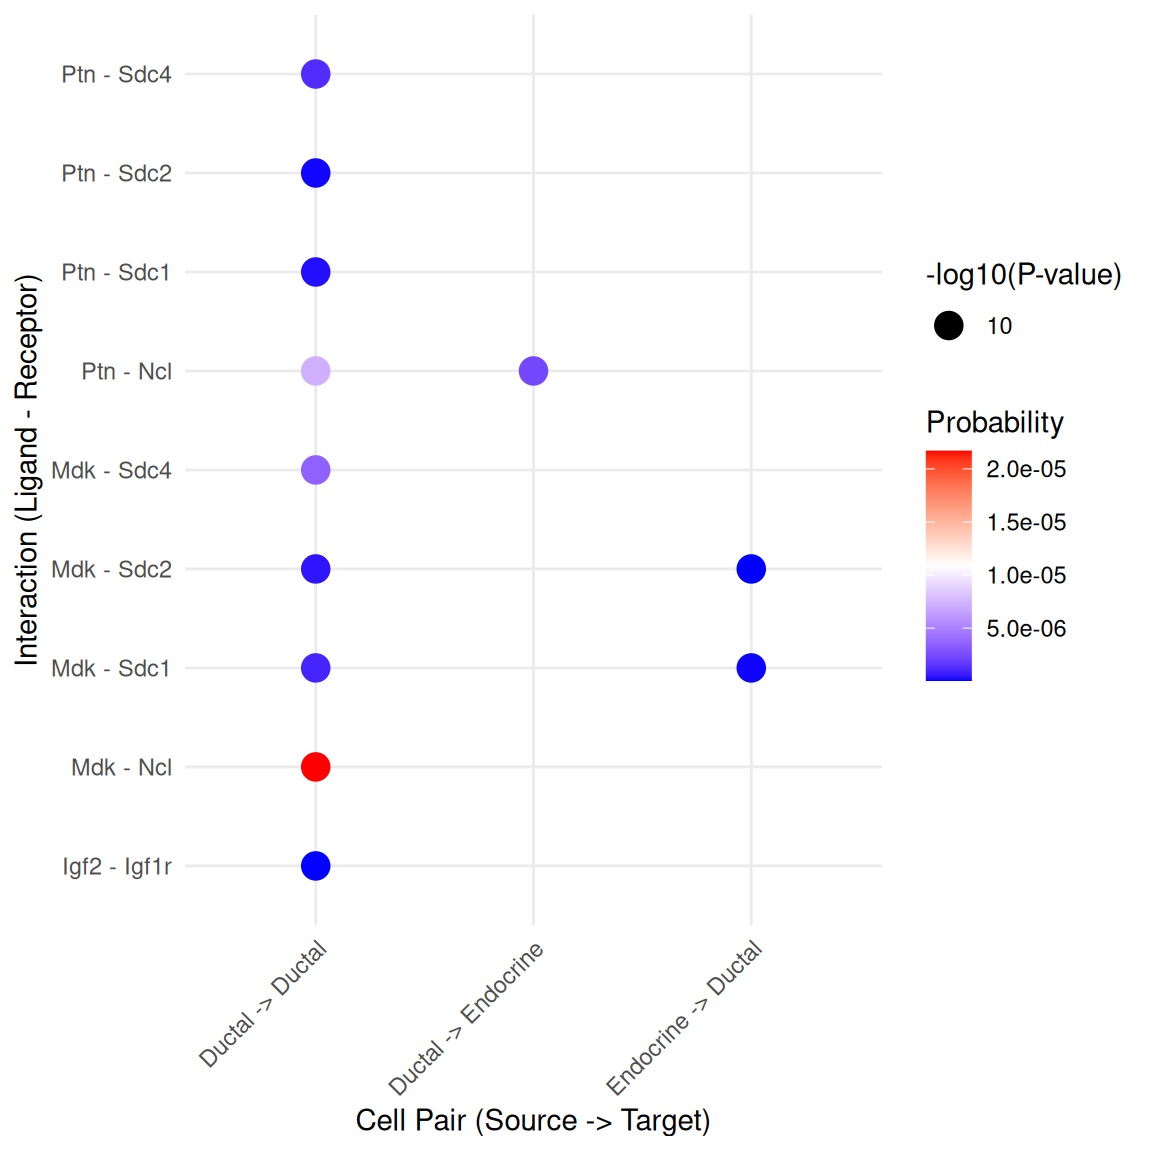
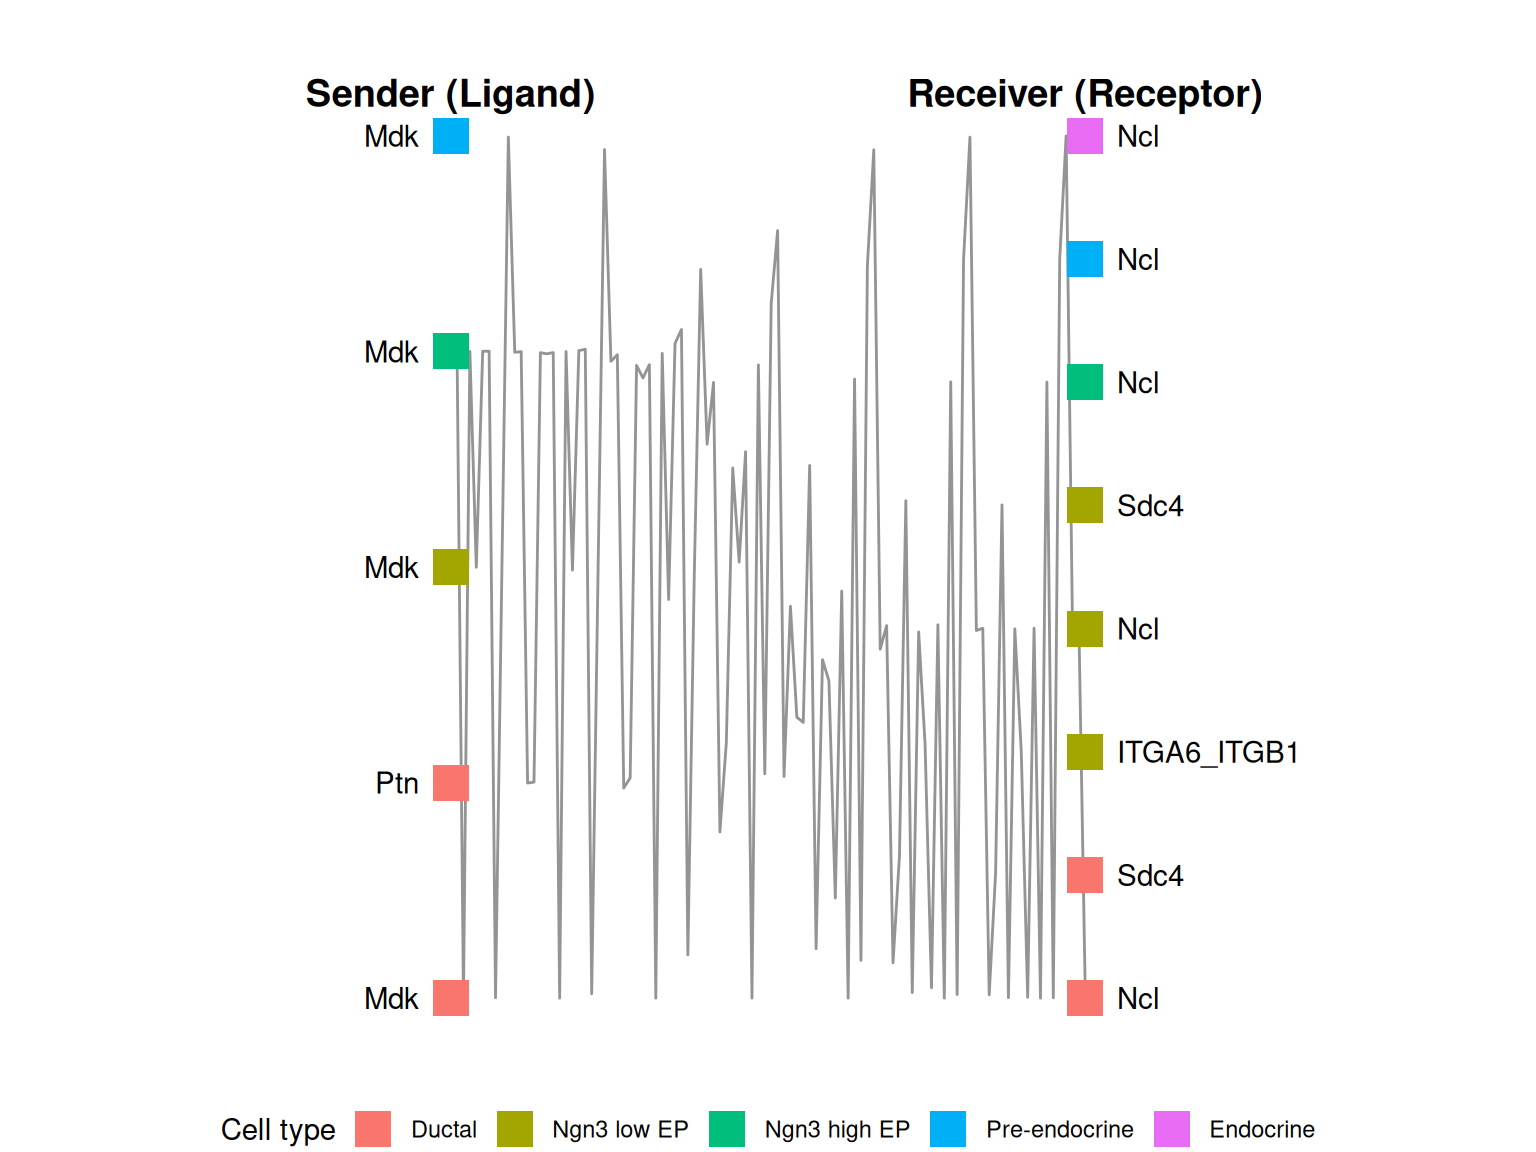
# Native Arrow plot between specific cell types
plot_cci_arrow(sce, cell_a = "Ductal", cell_b = "Endocrine", group = "CellType", top_n = 10)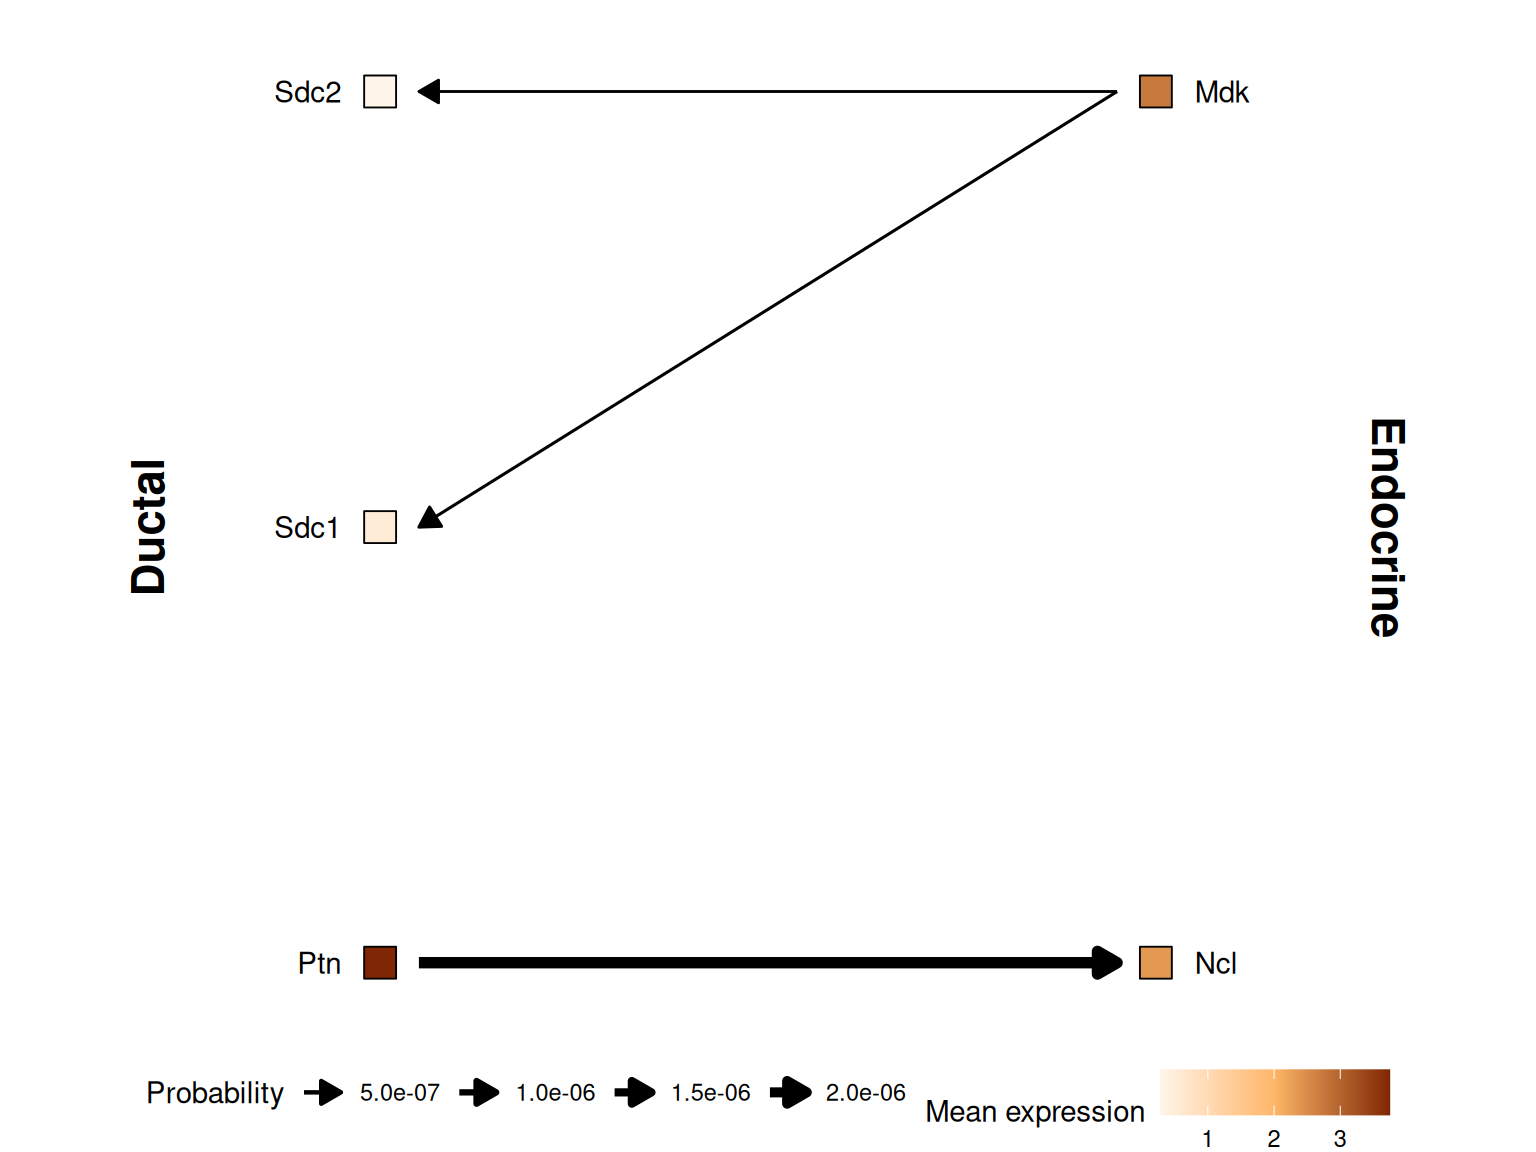
14.0.1 Legacy CellChat Visualization
If you still need the full power of CellChat’s specific visualizations, you can retrieve the original CellChat object and use it directly.
# Retrieve the original CellChat object if you need legacy plots
cci_obj <- get_cellchat(sce, element = "object")library(aplot)
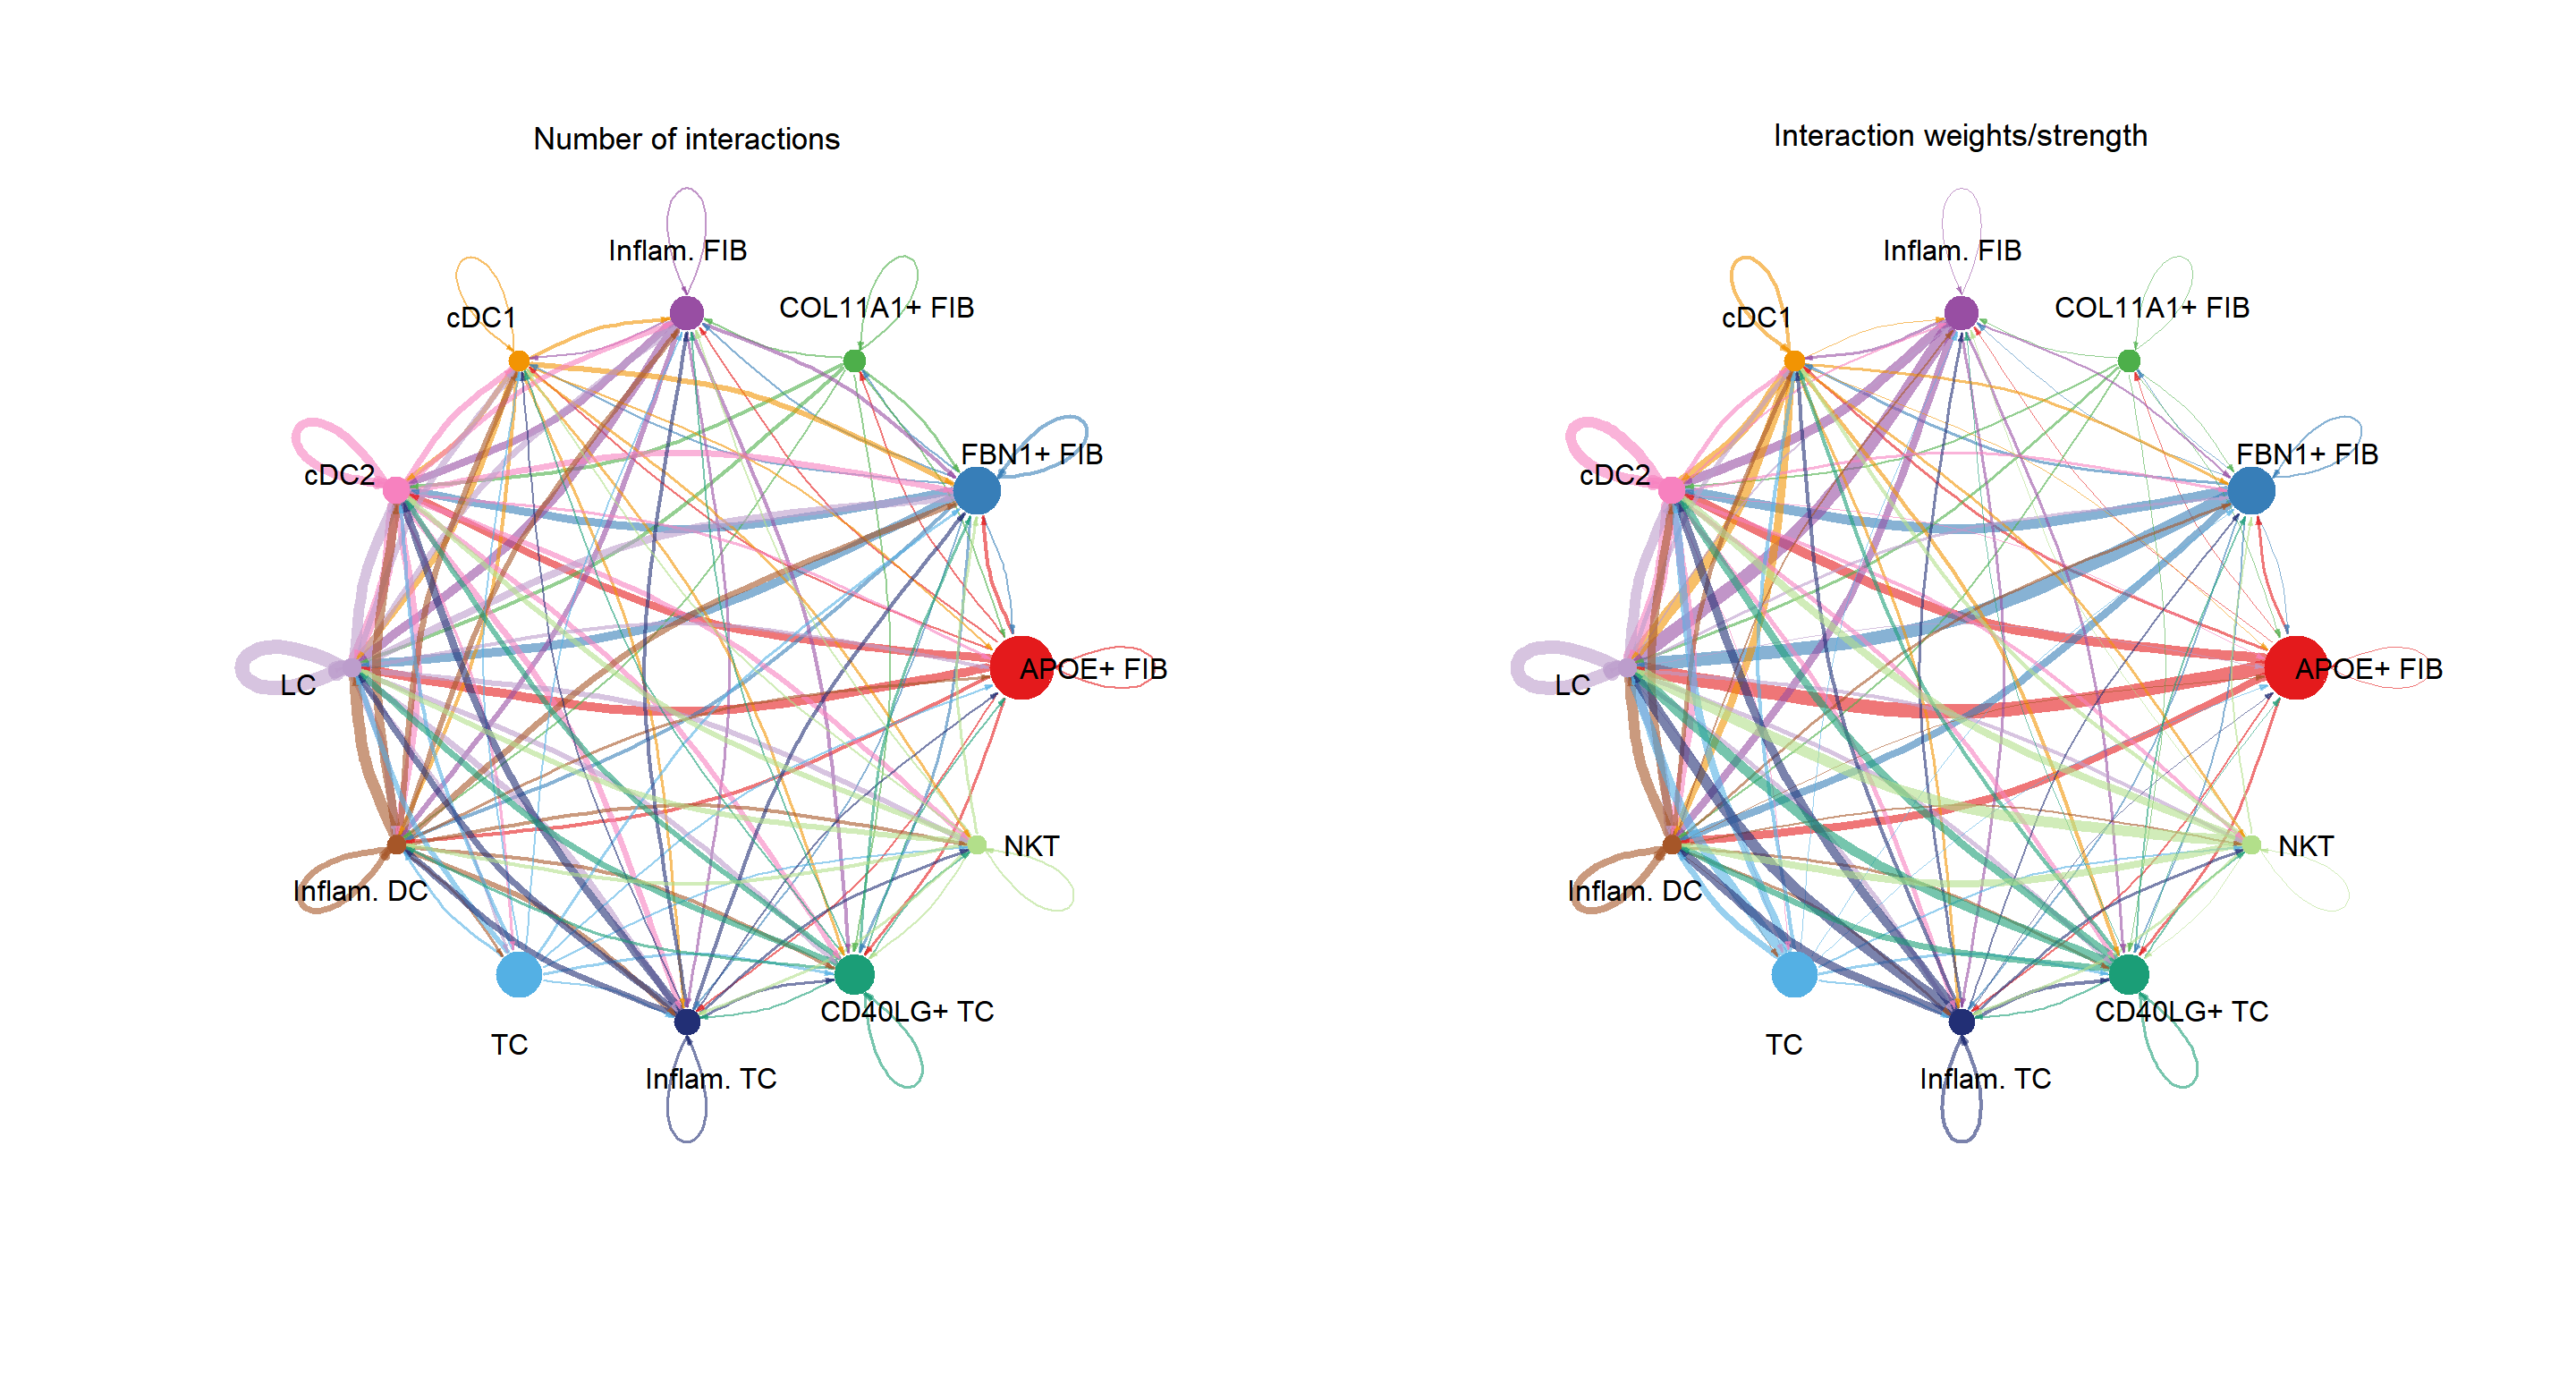
groupSize <- as.numeric(table(cci_obj@idents))
plot_list(
~CellChat::netVisual_circle(cci_obj@net$count,
vertex.weight = groupSize, weight.scale = T,
label.edge= F, title.name = "Number of interactions"),
~CellChat::netVisual_circle(cci_obj@net$weight,
vertex.weight = groupSize, weight.scale = T,
label.edge= F, title.name = "Interaction weights/strength")
)
pathways.show <- c("PTN")
CellChat::netVisual_aggregate(cci_obj, signaling = pathways.show, layout = "circle")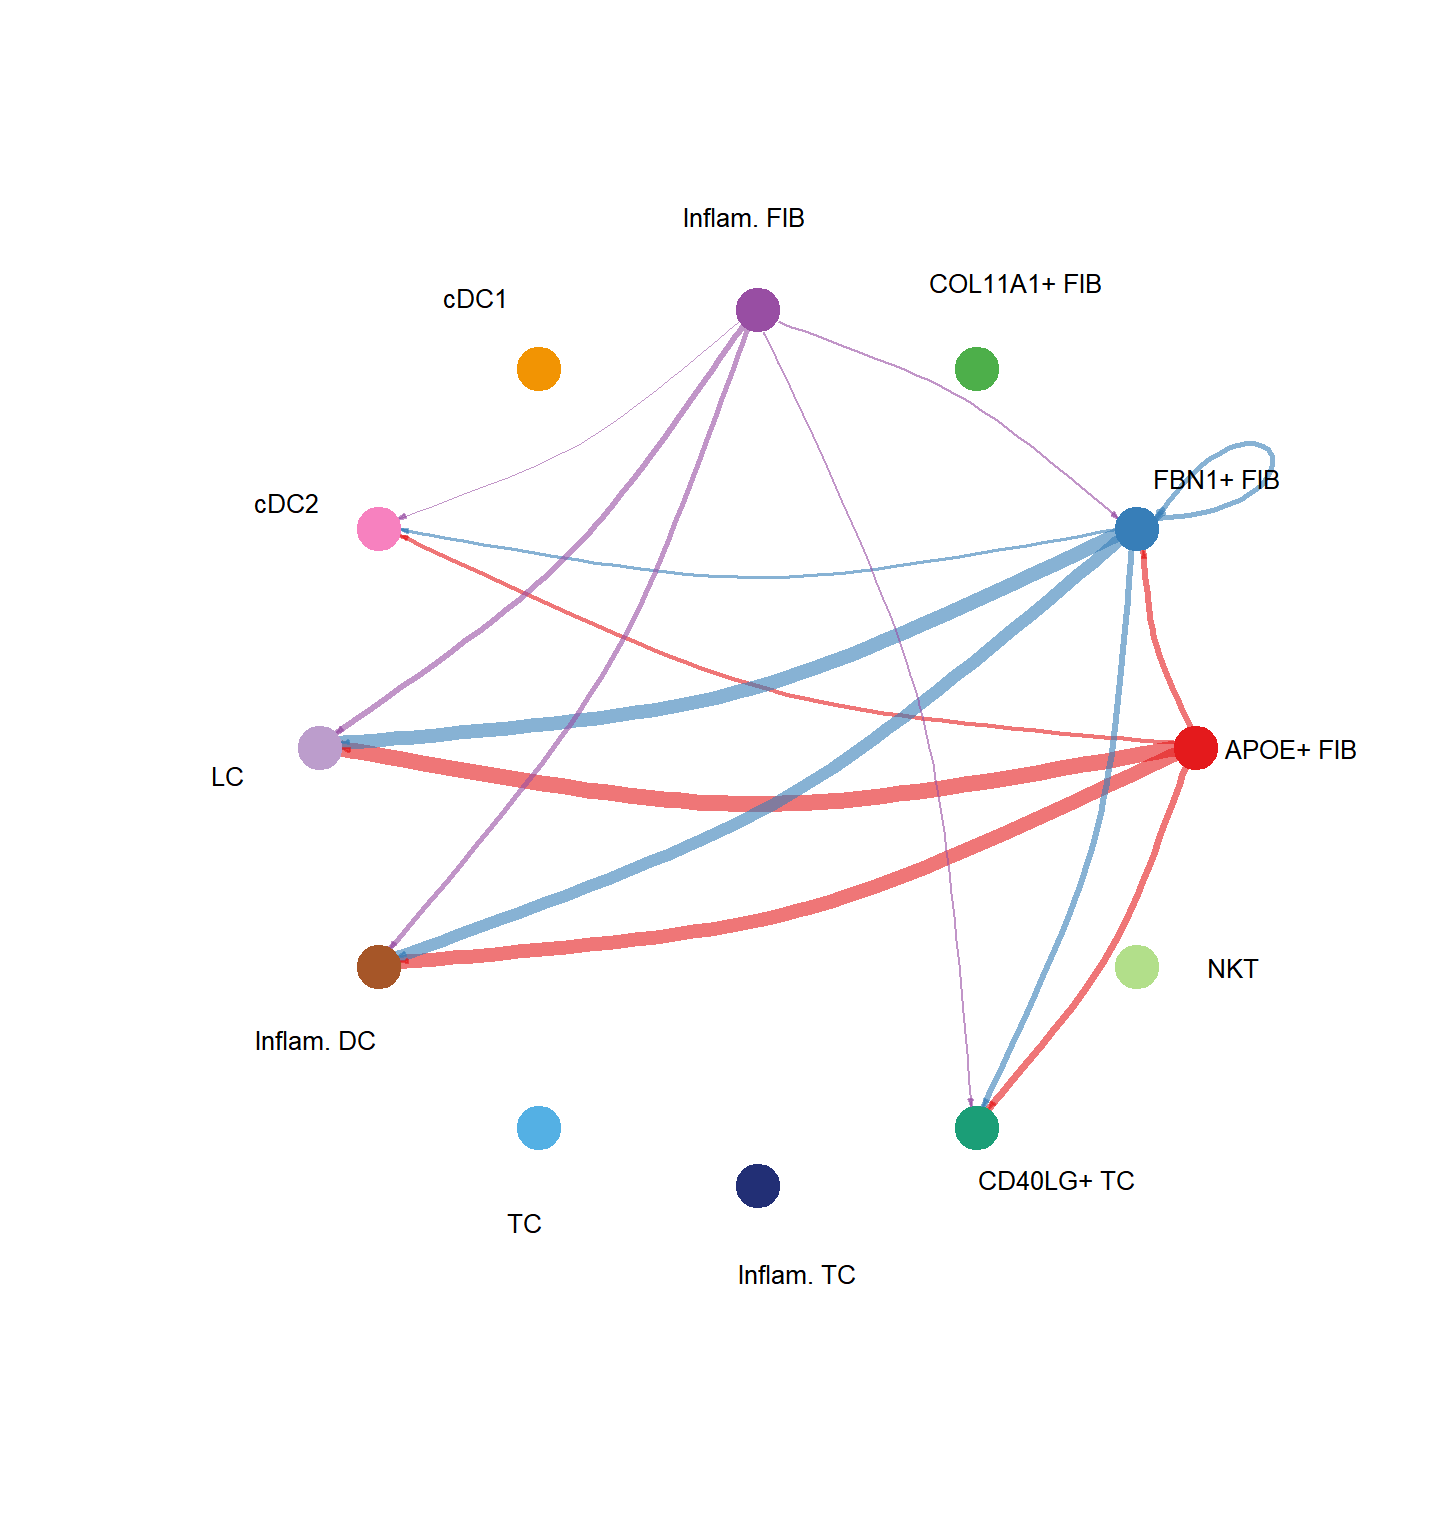
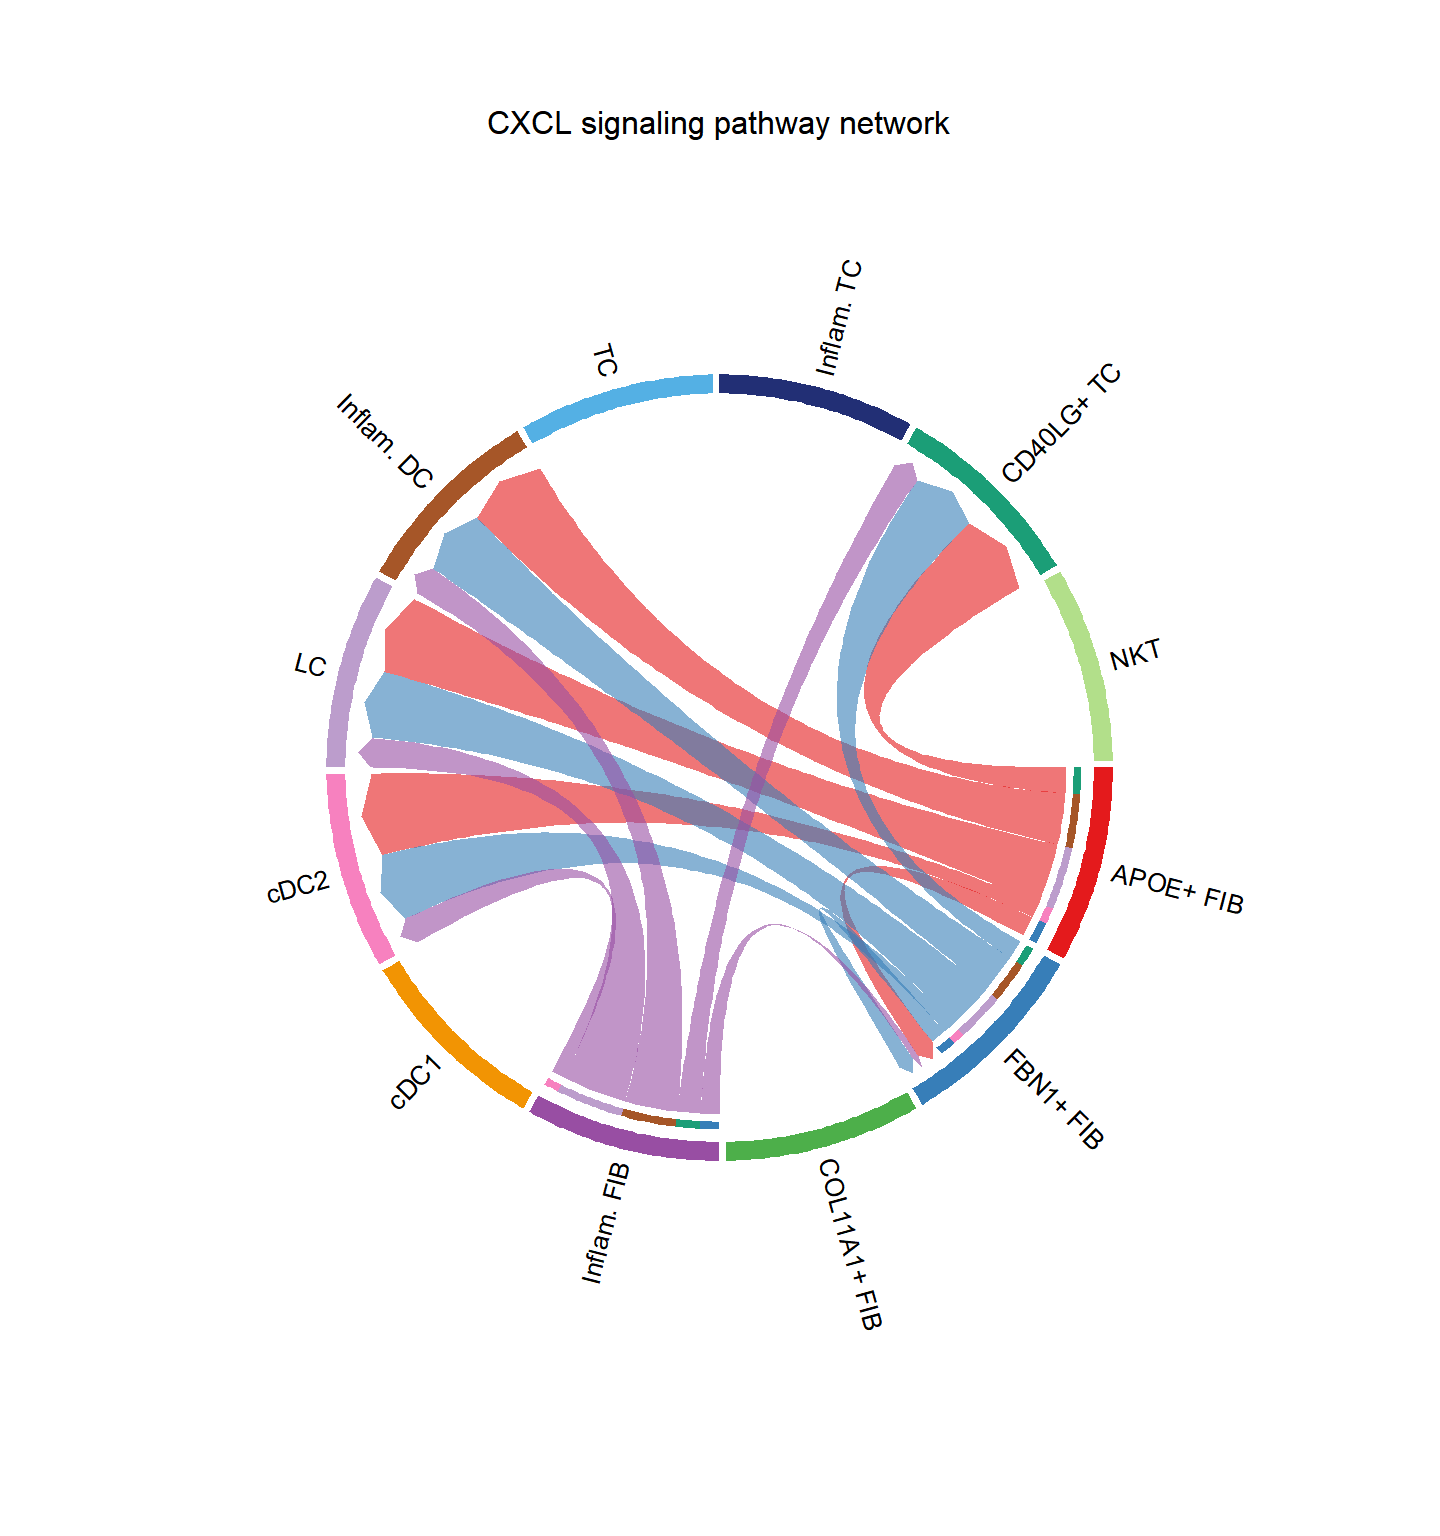
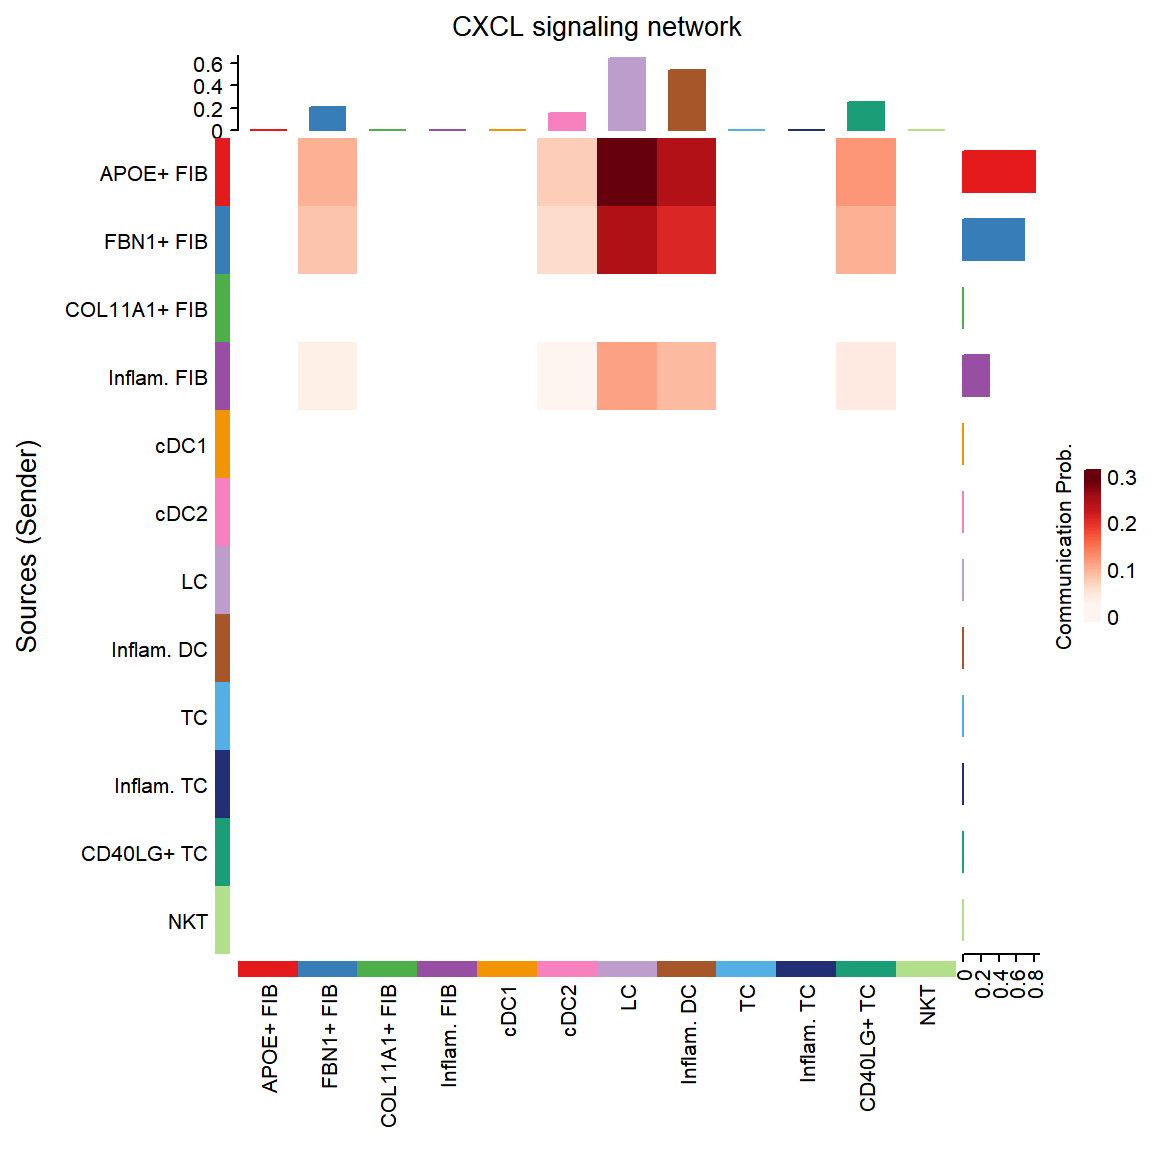
group.cellType <- c(rep("Epithelial", 3), rep("Endocrine", 2)) # grouping cell clusters into Epithelial and Endocrine cells
names(group.cellType) <- levels(cci_obj@idents)
CellChat::netVisual_chord_cell(cci_obj, signaling = pathways.show, group = group.cellType, title.name = paste0(pathways.show, " signaling network"))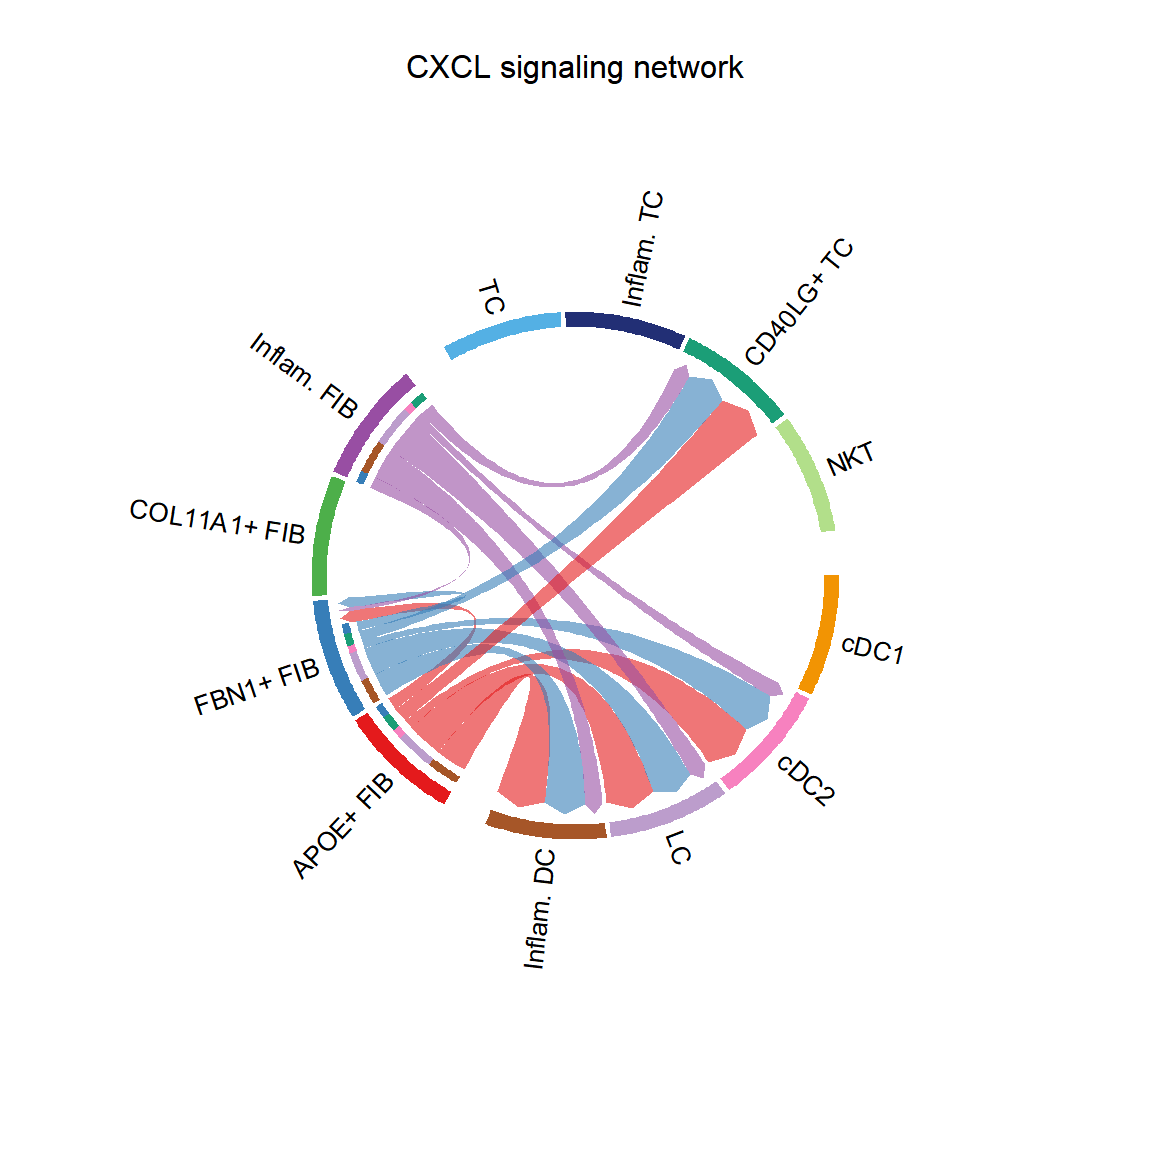
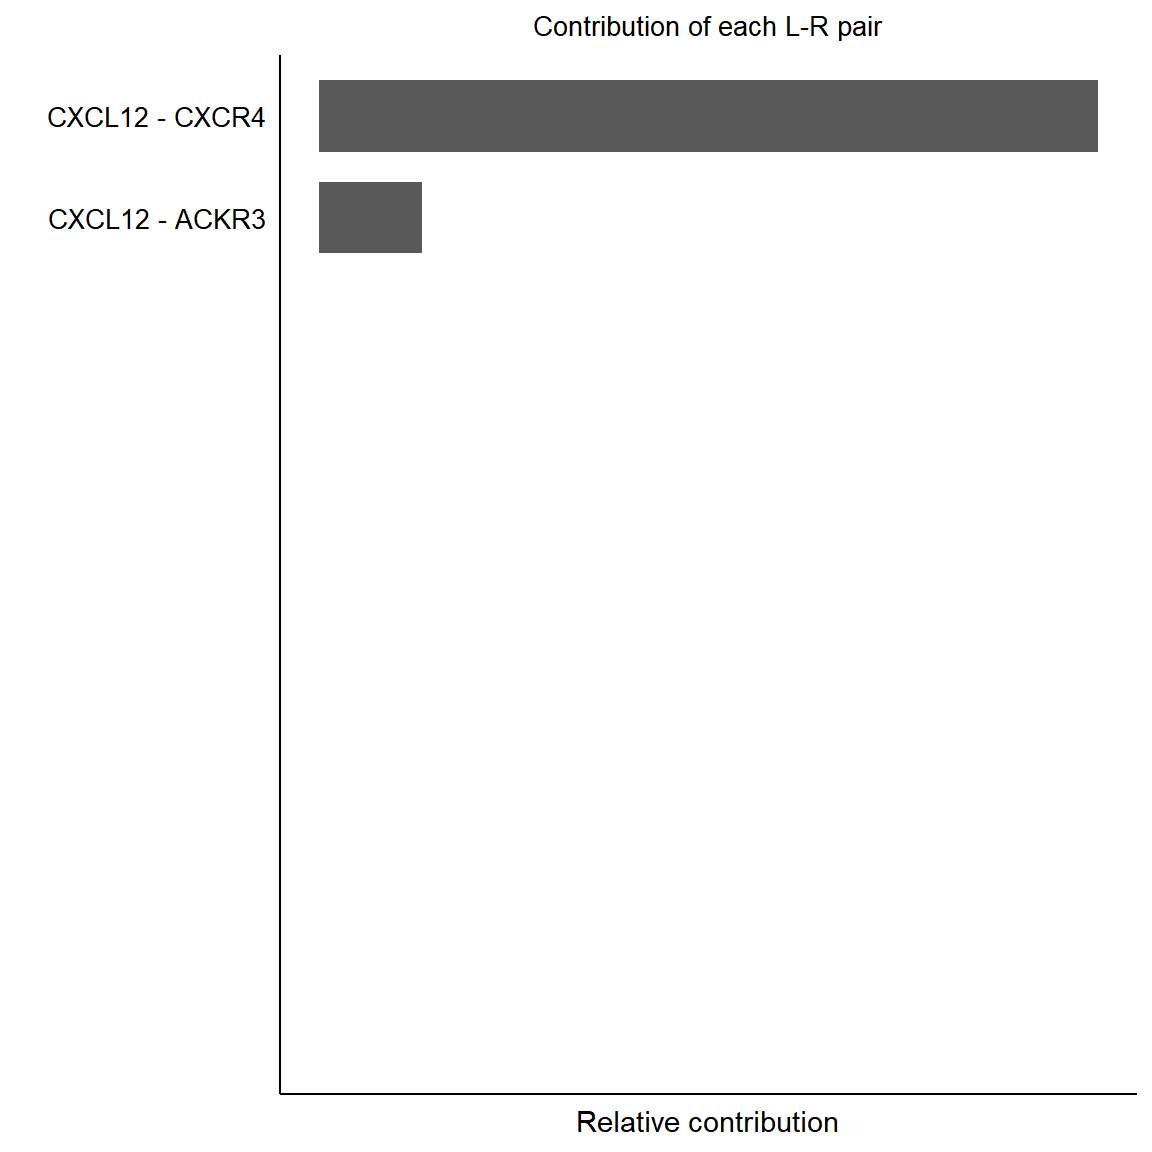
pairLR.pathway <- CellChat::extractEnrichedLR(cci_obj, signaling = pathways.show, geneLR.return = FALSE)
LR.show <- pairLR.pathway[1,]
vertex.receiver = seq(1,4)
# CellChat::netVisual_individual(cci_obj, signaling = pathways.show,  pairLR.use = LR.show, vertex.receiver = vertex.receiver)
CellChat::netVisual_individual(cci_obj, signaling = pathways.show, pairLR.use = LR.show, layout = "circle")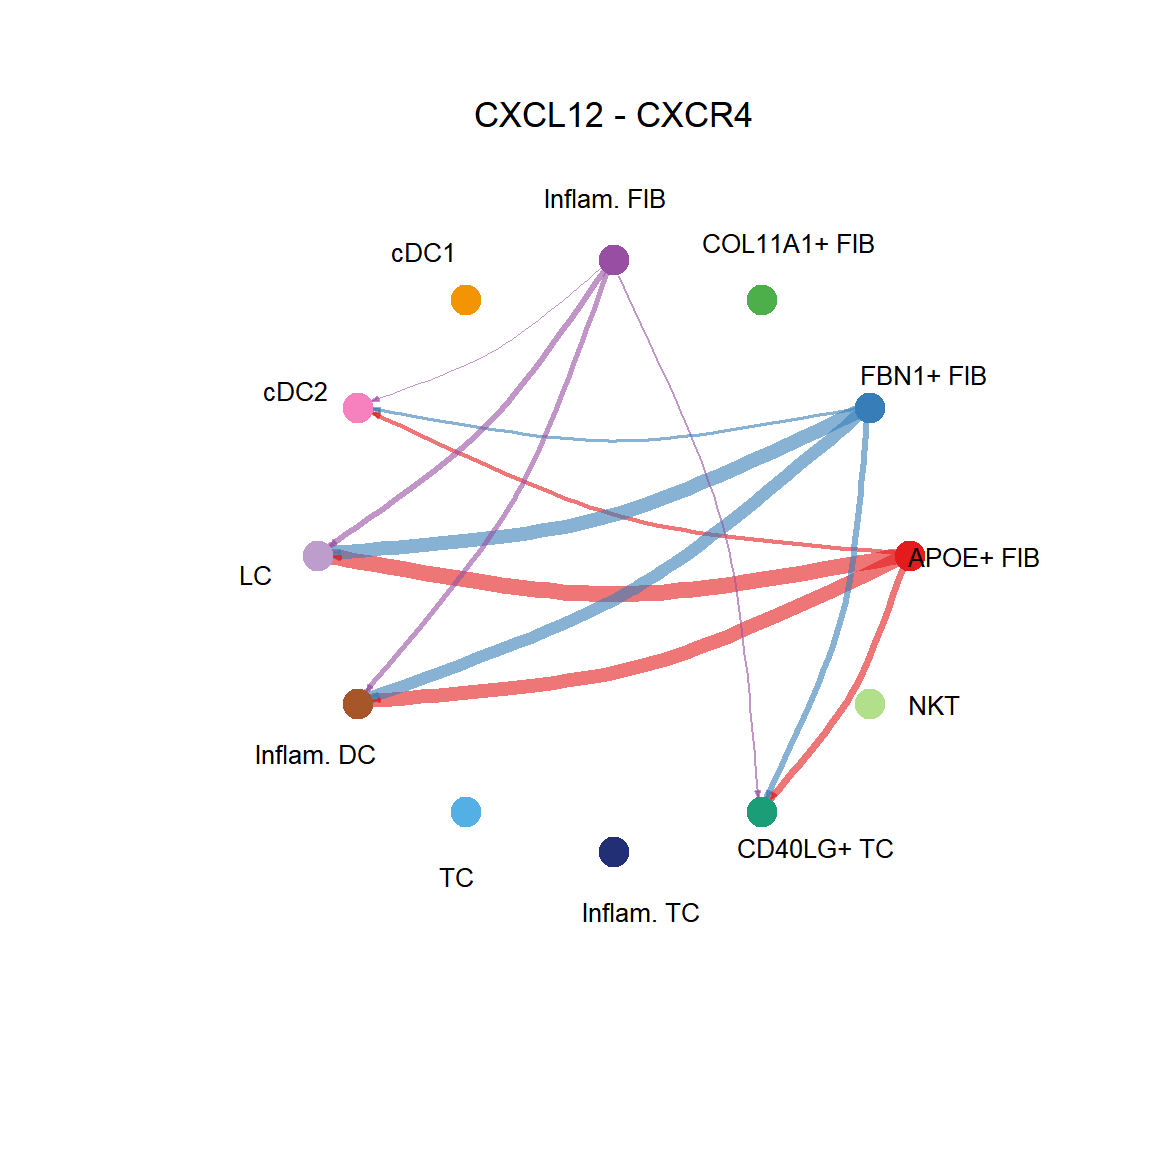
## [[1]]CellChat::netVisual_individual(cci_obj, signaling = pathways.show, pairLR.use = LR.show, layout = "chord")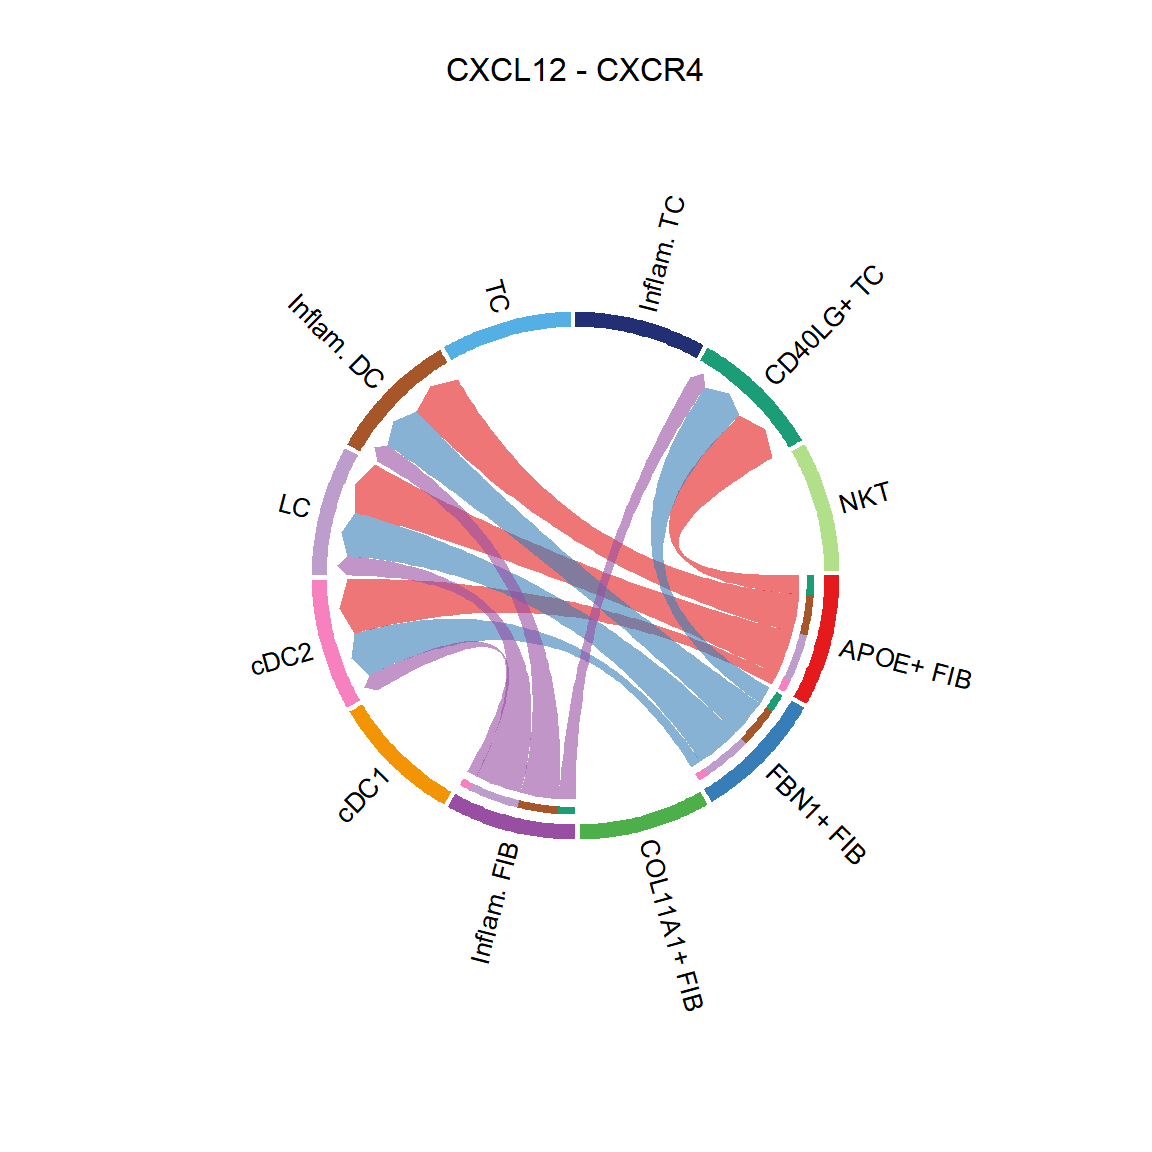
## [[1]]CellChat::netVisual_bubble(cci_obj, sources.use = 1:2, targets.use = c(3:5), remove.isolate = FALSE)