7 KEGG enrichment analysis
The KEGG FTP service is not freely available for academic use since 2012, and there are many software packages using out-dated KEGG annotation data. The clusterProfiler package supports downloading the latest online version of KEGG data using the KEGG website, which is freely available for academic users. Both the KEGG pathway and module are supported in clusterProfiler.
7.1 Supported organisms
The clusterProfiler package supports all organisms that have KEGG annotation data available in the KEGG database. Users should pass an abbreviation of academic name to the organism parameter. The full list of KEGG supported organisms can be accessed via http://www.genome.jp/kegg/catalog/org_list.html. KEGG Orthology (KO) Database is also supported by specifying organism = "ko".
The clusterProfiler package provides search_kegg_organism() function to help searching supported organisms.
library(clusterProfiler)
search_kegg_organism('ece', by='kegg_code')
## kegg_code scientific_name common_name
## 611 ece Escherichia coli O157:H7 EDL933 EHEC
## 4519 ecec Enterococcus cecorum Enterococcus cecorum
ecoli <- search_kegg_organism('Escherichia coli', by='scientific_name')
dim(ecoli)
## [1] 65 3
head(ecoli)## kegg_code scientific_name common_name
## 606 eco Escherichia coli K-12 MG1655 Escherichia coli K-12 MG1655
## 607 ecj Escherichia coli K-12 W3110 Escherichia coli K-12 W3110
## 608 ecd Escherichia coli K-12 DH10B Escherichia coli K-12 DH10B
## 609 ebw Escherichia coli K-12 BW2952 Escherichia coli K-12 BW2952
## 610 ecok Escherichia coli K-12 MDS42 Escherichia coli K-12 MDS42
## 611 ece Escherichia coli O157:H7 EDL933 EHEC7.2 KEGG pathway over-representation analysis
data(geneList, package="DOSE")
gene <- names(geneList)[abs(geneList) > 2]

kk <- enrichKEGG(gene         = gene,
                 organism     = 'hsa',
                 pvalueCutoff = 0.05)
head(kk)
## ID Description
## hsa04110 hsa04110 Cell cycle
## hsa04114 hsa04114 Oocyte meiosis
## hsa04218 hsa04218 Cellular senescence
## hsa04061 hsa04061 Viral protein interaction with cytokine and cytokine receptor
## hsa03320 hsa03320 PPAR signaling pathway
## hsa04914 hsa04914 Progesterone-mediated oocyte maturation
## GeneRatio BgRatio pvalue p.adjust qvalue
## hsa04110 11/94 126/8142 1.829412e-07 3.841764e-05 3.774365e-05
## hsa04114 10/94 131/8142 2.368439e-06 2.486861e-04 2.443231e-04
## hsa04218 10/94 156/8142 1.135672e-05 7.949704e-04 7.810235e-04
## hsa04061 8/94 100/8142 1.821466e-05 9.562698e-04 9.394931e-04
## hsa03320 7/94 75/8142 2.285993e-05 9.601169e-04 9.432728e-04
## hsa04914 7/94 102/8142 1.651911e-04 5.781690e-03 5.680256e-03
## geneID Count
## hsa04110 8318/991/9133/890/983/4085/7272/1111/891/4174/9232 11
## hsa04114 991/9133/983/4085/51806/6790/891/9232/3708/5241 10
## hsa04218 2305/4605/9133/890/983/51806/1111/891/776/3708 10
## hsa04061 3627/10563/6373/4283/6362/6355/9547/1524 8
## hsa03320 4312/9415/9370/5105/2167/3158/5346 7
## hsa04914 9133/890/983/4085/6790/891/5241 7Input ID type can be kegg, ncbi-geneid, ncbi-proteinid or uniprot (see also session 16.1.2). Unlike enrichGO(), there is no readable parameter for enrichKEGG(). However, users can use the setReadable() function if there is an OrgDb available for the species.
7.3 KEGG pathway gene set enrichment analysis
kk2 <- gseKEGG(geneList     = geneList,
               organism     = 'hsa',
               minGSSize    = 120,
               pvalueCutoff = 0.05,
               verbose      = FALSE)
head(kk2)
## ID Description setSize
## hsa05169 hsa05169 Epstein-Barr virus infection 193
## hsa04613 hsa04613 Neutrophil extracellular trap formation 130
## hsa05166 hsa05166 Human T-cell leukemia virus 1 infection 202
## hsa04510 hsa04510 Focal adhesion 190
## hsa04218 hsa04218 Cellular senescence 141
## hsa05170 hsa05170 Human immunodeficiency virus 1 infection 189
## enrichmentScore NES pvalue p.adjust qvalues rank
## hsa05169 0.4335010 1.962039 5.505487e-08 4.239225e-06 2.839672e-06 2820
## hsa04613 0.4496569 1.934454 6.345081e-06 2.442856e-04 1.636363e-04 2575
## hsa05166 0.3893613 1.755469 1.357530e-05 3.484327e-04 2.333999e-04 1955
## hsa04510 -0.4169068 -1.691234 2.771385e-05 5.334917e-04 3.573629e-04 2183
## hsa04218 0.4115945 1.783044 5.168200e-05 7.959028e-04 5.331406e-04 1155
## hsa05170 0.3711150 1.677643 1.118012e-04 1.229814e-03 8.237986e-04 3178
## leading_edge
## hsa05169 tags=39%, list=23%, signal=31%
## hsa04613 tags=37%, list=21%, signal=30%
## hsa05166 tags=26%, list=16%, signal=22%
## hsa04510 tags=27%, list=17%, signal=22%
## hsa04218 tags=17%, list=9%, signal=16%
## hsa05170 tags=38%, list=25%, signal=29%
## core_enrichment
## hsa05169 3627/890/6890/9636/898/9134/6502/6772/3126/3112/4609/917/5709/1869/3654/919/915/4067/4938/864/4940/5713/5336/11047/3066/54205/1871/578/1019/637/916/3383/4939/10213/23586/4793/5603/7979/7128/6891/930/5714/3452/6850/5702/4794/7124/3569/7097/5708/2208/8772/3119/5704/7186/5971/3135/1380/958/5610/4792/10018/8819/3134/10379/9641/1147/5718/6300/3109/811/5606/2923/3108/5707/1432
## hsa04613 820/366/51311/64581/3015/85236/55506/8970/8357/1535/2359/5336/4688/92815/3066/8336/292/1991/3689/8345/5603/4689/5880/10105/1184/6404/3018/6850/5604/3014/7097/1378/8290/1536/834/5605/1183/728/2215/8335/5594/9734/3674/5578/5582/7417/8331/6300
## hsa05166 991/9133/890/4085/7850/1111/9232/8061/701/9700/898/4316/9134/3932/3559/3126/3112/4609/3561/917/1869/1029/915/114/2005/5902/55697/1871/1031/2224/292/1019/3689/916/3383/11200/706/3600/6513/3601/468/5604/7124/1030/3569/4049/4055/10393/3119/5901/5971/1959/3135
## hsa04510 5595/5228/7424/1499/4636/83660/7059/5295/1288/23396/3910/3371/3082/1291/394/3791/7450/596/3685/1280/3675/595/2318/3912/1793/1278/1277/1293/10398/55742/2317/7058/25759/56034/3693/3480/5159/857/1292/3908/3909/63923/3913/1287/3679/7060/3479/10451/80310/1311/1101
## hsa04218 2305/4605/9133/890/983/51806/1111/891/993/3576/1978/898/9134/4609/1869/1029/22808/1871/5499/91860/292/1019/11200/1875
## hsa05170 9133/9582/983/51806/1111/891/6890/200315/917/3654/919/915/5336/54205/91860/578/995/25939/637/1234/916/5603/2792/5880/6891/6921/3452/5604/7124/9978/7097/7852/8772/1174/7186/3135/164/60489/2787/356/7133/5605/27350/6199/1642/5594/4792/3134/5578/4893/8454/5582/2786/1147/3984/6300/200316/811/5606/2923/4775/162/1432/2784/836/5747/5058/3106/2770/5534/5579/46157.4 KEGG module over-representation analysis
KEGG Module is a collection of manually defined function units. In some situation, KEGG Modules have a more straightforward interpretation.
mkk <- enrichMKEGG(gene = gene,
                   organism = 'hsa',
                   pvalueCutoff = 1,
                   qvalueCutoff = 1)
head(mkk)
## ID Description
## M00912 M00912 NAD biosynthesis, tryptophan => quinolinate => NAD
## M00095 M00095 C5 isoprenoid biosynthesis, mevalonate pathway
## M00053 M00053 Pyrimidine deoxyribonucleotide biosynthesis, CDP => dCTP
## M00938 M00938 Pyrimidine deoxyribonucleotide biosynthesis, UDP => dTTP
## M00003 M00003 Gluconeogenesis, oxaloacetate => fructose-6P
## M00049 M00049 Adenine ribonucleotide biosynthesis, IMP => ADP,ATP
## GeneRatio BgRatio pvalue p.adjust qvalue geneID Count
## M00912 2/9 12/831 0.006511179 0.03906707 0.03426936 23475/3620 2
## M00095 1/9 10/831 0.103710201 0.18875552 0.16557502 3158 1
## M00053 1/9 11/831 0.113535546 0.18875552 0.16557502 6241 1
## M00938 1/9 14/831 0.142439710 0.18875552 0.16557502 6241 1
## M00003 1/9 18/831 0.179674425 0.18875552 0.16557502 5105 1
## M00049 1/9 19/831 0.188755520 0.18875552 0.16557502 26289 17.5 KEGG module gene set enrichment analysis
##            ID                                                      Description
## M00001 M00001        Glycolysis (Embden-Meyerhof pathway), glucose => pyruvate
## M00035 M00035                                           Methionine degradation
## M00938 M00938         Pyrimidine deoxyribonucleotide biosynthesis, UDP => dTTP
## M00002 M00002         Glycolysis, core module involving three-carbon compounds
## M00104 M00104 Bile acid biosynthesis, cholesterol => cholate/chenodeoxycholate
## M00009 M00009                           Citrate cycle (TCA cycle, Krebs cycle)
##        setSize enrichmentScore       NES      pvalue  p.adjust   qvalues rank
## M00001      24       0.5739036  1.730700 0.007416486 0.2299111 0.2107843 2886
## M00035      10       0.6784636  1.618325 0.034867787 0.3247648 0.2977471 1555
## M00938      10       0.6648004  1.585734 0.041905141 0.3247648 0.2977471  648
## M00002      11       0.6421781  1.567871 0.037338973 0.3247648 0.2977471 1381
## M00104      10      -0.5876900 -1.335111 0.135338346 0.6486696 0.5947056  961
## M00009      22       0.4504911  1.329189 0.120512821 0.6486696 0.5947056 3514
##                          leading_edge
## M00001 tags=54%, list=23%, signal=42%
## M00035 tags=50%, list=12%, signal=44%
## M00938  tags=40%, list=5%, signal=38%
## M00002 tags=55%, list=11%, signal=49%
## M00104  tags=50%, list=8%, signal=46%
## M00009 tags=50%, list=28%, signal=36%
##                                                         core_enrichment
## M00001 5214/3101/2821/7167/2597/5230/2023/5223/5315/3099/5232/2027/5211
## M00035                                           875/1789/191/1788/1786
## M00938                                              6241/7298/4830/1841
## M00002                                    7167/2597/5230/2023/5223/5315
## M00104                                        6342/10998/1581/3295/8309
## M00009            3418/50/4190/3419/2271/3421/55753/3417/1431/6389/4191
7.6 Visualize enriched KEGG pathways
The enrichplot package implements several methods to visualize enriched terms. Most of them are general methods that can be used on GO, KEGG, MSigDb, and other gene set annotations. Here, we introduce the clusterProfiler::browseKEGG() and pathview::pathview() functions to help users explore enriched KEGG pathways with genes of interest.
To view the KEGG pathway, users can use the browseKEGG function, which will open a web browser and highlight enriched genes.
browseKEGG(kk, 'hsa04110')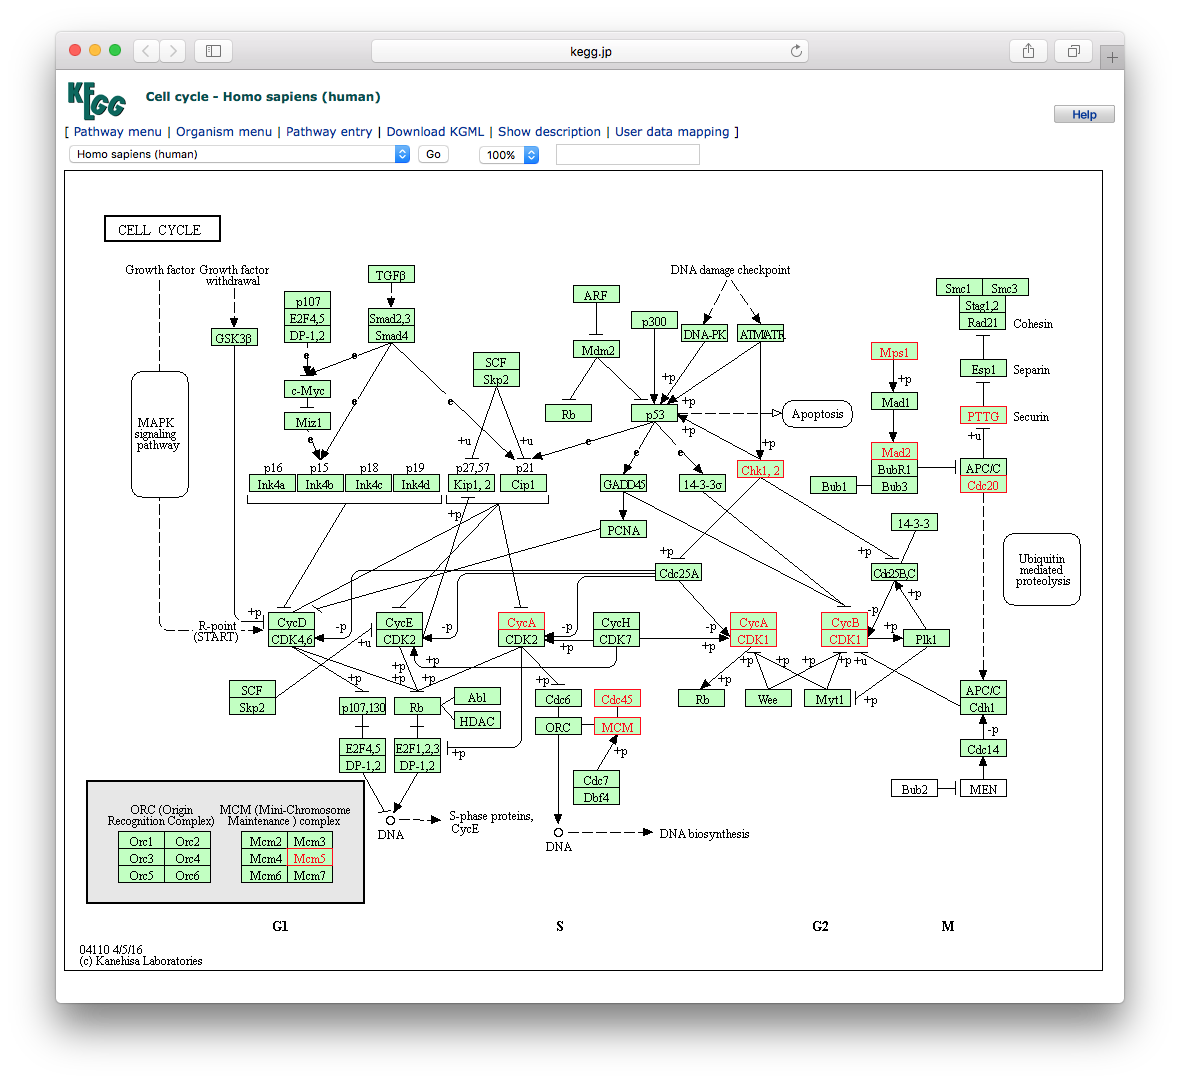
Figure 7.1: Explore selected KEGG pathway. Differentially expressed genes that are enriched in the selected pathway will be highlighted.
Users can also use the pathview() function from the pathview (Luo and Brouwer 2013) to visualize enriched KEGG pathways identified by the clusterProfiler package (Yu et al. 2012).
The following example illustrates how to visualize the “hsa04110” pathway, which was enriched in our previous analysis.
library("pathview")
hsa04110 <- pathview(gene.data  = geneList,
                     pathway.id = "hsa04110",
                     species    = "hsa",
                     limit      = list(gene=max(abs(geneList)), cpd=1))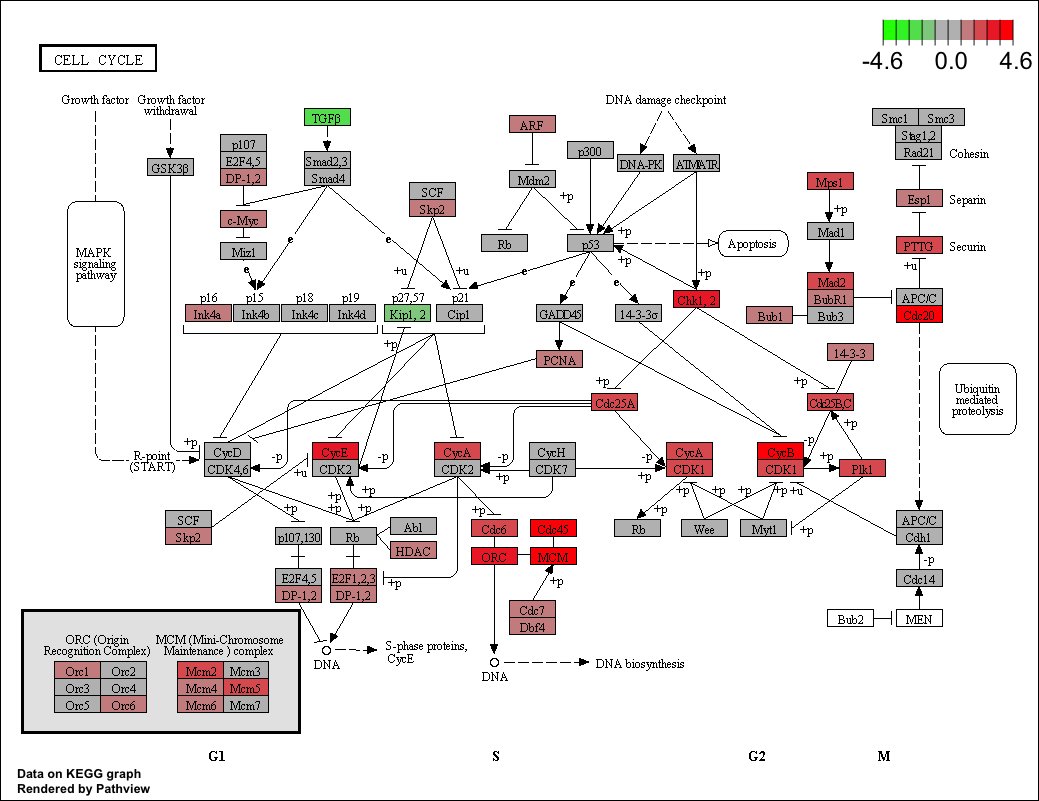
Figure 7.2: Visualize selected KEGG pathway by pathview(). Gene expression values can be mapped to gradient color scale.