Dear Guangchuang,
I am enjoyiung very much to use your extremely helpful clusterProfiler
package (and the related Packages underneath).I have a question to cnetplot: How can I label the categories but not
the genes?In some situations the categories are so large, that plotting all the
gene names is not an option. But I’d still want to have the category
names so that removing the node labels all together is not an option either.Thanks in advance for any help!
Kind Regards,
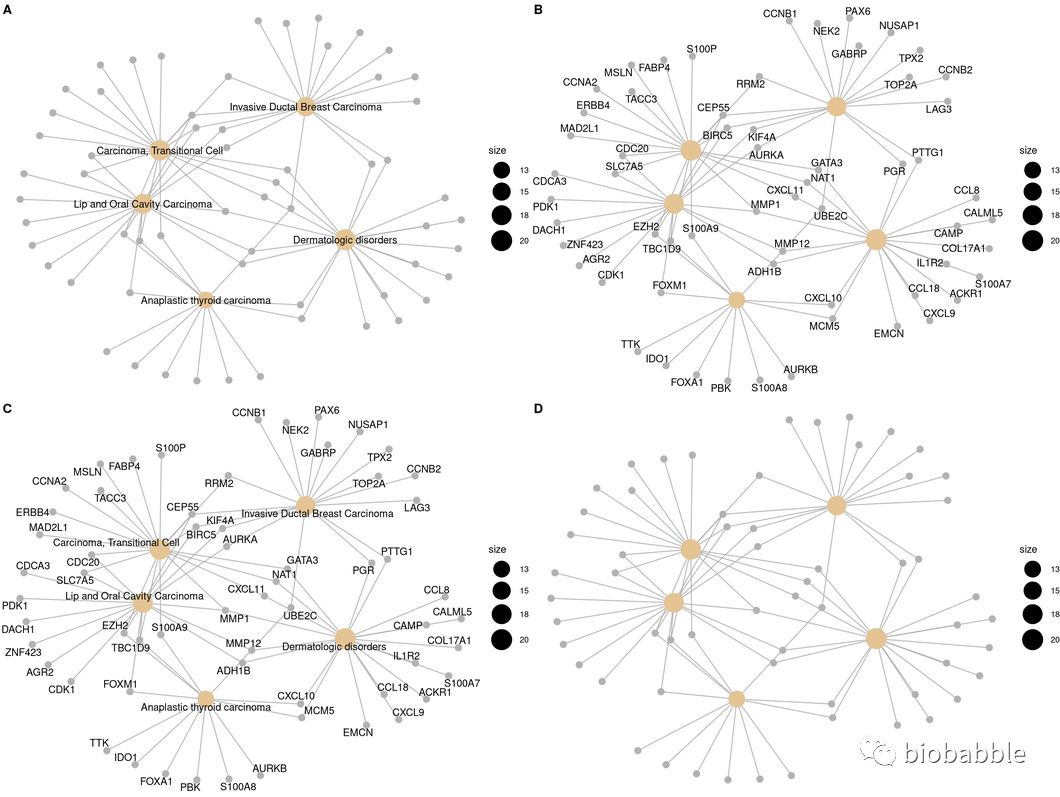
用户的问题,说只想要在cnetplot中把category给打出来,但不想打出来基因名字。这个问题因为不止一次被问到了,所以我感觉是个普遍的需求,于是撸起袖子,把代码给改一下。现在你可以使用node_label这个参数,它有四种选项,“category”, “gene”, “all”和”none”,顾名思义,打富集的集合名,基因名,全打,和全都不打。只打集合名还是有一点的用处的,因为基因名太多,容易overlap,如果不打出来,那么可以在画图的时候,放出更多的集合出来。
实例演示
library(DOSE)
data(geneList)
de <- names(geneList)[abs(geneList) > 2]

edo <- enrichDGN(de)
edox <- setReadable(edo, 'org.Hs.eg.db', 'ENTREZID')
p1 <- cnetplot(edox, node_label="category")
p2 <- cnetplot(edox, node_label="gene")
p3 <- cnetplot(edox, node_label="all")
p4 <- cnetplot(edox, node_label="none")
cowplot::plot_grid(p1, p2, p3, p4, ncol=2, labels=LETTERS[1:4])
往期精彩